
Advertisement
Ta Ann Holdings Berhad's(KLSE:TAANN) Share Price Is Down 36% Over The Past Five Years.
In order to justify the effort of selecting individual stocks, it's worth striving to beat the returns from a market index fund. But in any portfolio, there will be mixed results between individual stocks. So we wouldn't blame long term Ta Ann Holdings Berhad (KLSE:TAANN) shareholders for doubting their decision to hold, with the stock down 36% over a half decade. More recently, the share price has dropped a further 9.1% in a month.
Check out our latest analysis for Ta Ann Holdings Berhad
There is no denying that markets are sometimes efficient, but prices do not always reflect underlying business performance. One imperfect but simple way to consider how the market perception of a company has shifted is to compare the change in the earnings per share (EPS) with the share price movement.
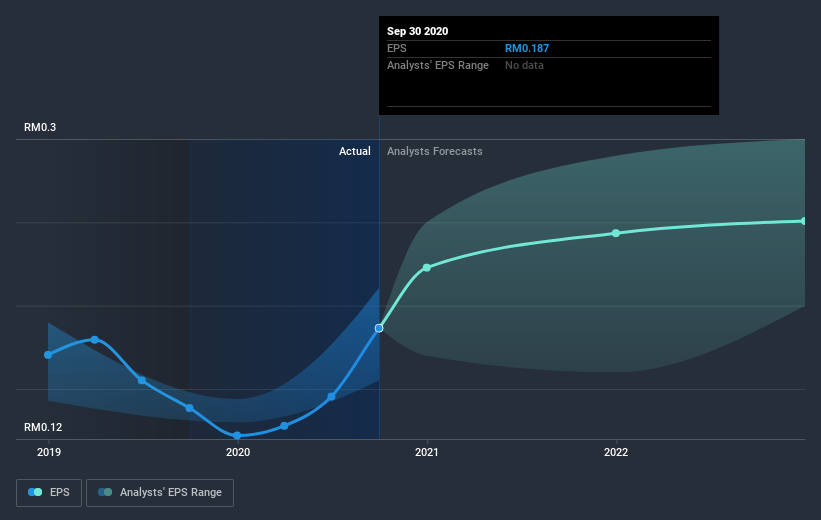
During the five years over which the share price declined, Ta Ann Holdings Berhad's earnings per share (EPS) dropped by 11% each year. The share price decline of 9% per year isn't as bad as the EPS decline. So the market may previously have expected a drop, or else it expects the situation will improve.
The graphic below depicts how EPS has changed over time (unveil the exact values by clicking on the image).
We know that Ta Ann Holdings Berhad has improved its bottom line lately, but is it going to grow revenue? This free report showing analyst revenue forecasts should help you figure out if the EPS growth can be sustained.
What About Dividends?
When looking at investment returns, it is important to consider the difference between total shareholder return (TSR) and share price return. The TSR incorporates the value of any spin-offs or discounted capital raisings, along with any dividends, based on the assumption that the dividends are reinvested. It's fair to say that the TSR gives a more complete picture for stocks that pay a dividend. We note that for Ta Ann Holdings Berhad the TSR over the last 5 years was -26%, which is better than the share price return mentioned above. This is largely a result of its dividend payments!
A Different Perspective
Investors in Ta Ann Holdings Berhad had a tough year, with a total loss of 9.0% (including dividends), against a market gain of about 6.0%. However, keep in mind that even the best stocks will sometimes underperform the market over a twelve month period. Regrettably, last year's performance caps off a bad run, with the shareholders facing a total loss of 5% per year over five years. We realise that Baron Rothschild has said investors should "buy when there is blood on the streets", but we caution that investors should first be sure they are buying a high quality business. I find it very interesting to look at share price over the long term as a proxy for business performance. But to truly gain insight, we need to consider other information, too. Even so, be aware that Ta Ann Holdings Berhad is showing 1 warning sign in our investment analysis , you should know about...
If you are like me, then you will not want to miss this free list of growing companies that insiders are buying.
Please note, the market returns quoted in this article reflect the market weighted average returns of stocks that currently trade on MY exchanges.
If you’re looking to trade Ta Ann Holdings Berhad, open an account with the lowest-cost* platform trusted by professionals, Interactive Brokers. Their clients from over 200 countries and territories trade stocks, options, futures, forex, bonds and funds worldwide from a single integrated account. Promoted
Valuation is complex, but we're here to simplify it.
Discover if Ta Ann Holdings Berhad might be undervalued or overvalued with our detailed analysis, featuring fair value estimates, potential risks, dividends, insider trades, and its financial condition.
Access Free AnalysisThis article by Simply Wall St is general in nature. It does not constitute a recommendation to buy or sell any stock, and does not take account of your objectives, or your financial situation. We aim to bring you long-term focused analysis driven by fundamental data. Note that our analysis may not factor in the latest price-sensitive company announcements or qualitative material. Simply Wall St has no position in any stocks mentioned.
*Interactive Brokers Rated Lowest Cost Broker by StockBrokers.com Annual Online Review 2020
Have feedback on this article? Concerned about the content? Get in touch with us directly. Alternatively, email editorial-team (at) simplywallst.com.
About KLSE:TAANN
Ta Ann Holdings Berhad
An investment holding company, operates as a timber and oil palm plantation company.
Flawless balance sheet, undervalued and pays a dividend.
Similar Companies
Market Insights

Advertisement
Community Narratives
The company that turned a verb into a global necessity and basically runs the modern internet, digital ads, smartphones, maps, and AI.
Fair Value US$300.00|6.2% undervalued
OS
Community Contributor
Flowers Foods Pays A Fair Price For Health
Fair Value US$16.12|25.1% undervalued
NV
Community Contributor
TMX Group will thrive with 33.3% profit margin and enduring market moat
Fair Value CA$49.90|0.04% overvalued
LI
Community Contributor