
Advertisement
Does Scientex Berhad (KLSE:SCIENTX) Have A Healthy Balance Sheet?
Warren Buffett famously said, 'Volatility is far from synonymous with risk.' When we think about how risky a company is, we always like to look at its use of debt, since debt overload can lead to ruin. Importantly, Scientex Berhad (KLSE:SCIENTX) does carry debt. But the real question is whether this debt is making the company risky.
When Is Debt Dangerous?
Debt is a tool to help businesses grow, but if a business is incapable of paying off its lenders, then it exists at their mercy. In the worst case scenario, a company can go bankrupt if it cannot pay its creditors. However, a more common (but still painful) scenario is that it has to raise new equity capital at a low price, thus permanently diluting shareholders. Of course, the upside of debt is that it often represents cheap capital, especially when it replaces dilution in a company with the ability to reinvest at high rates of return. When we examine debt levels, we first consider both cash and debt levels, together.
Check out our latest analysis for Scientex Berhad
What Is Scientex Berhad's Net Debt?
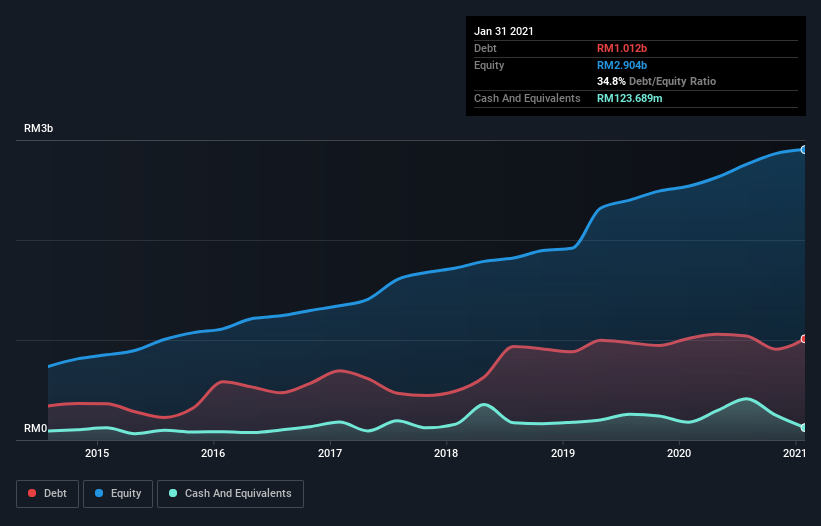
As you can see below, Scientex Berhad had RM1.01b of debt, at January 2021, which is about the same as the year before. You can click the chart for greater detail. However, it also had RM123.7m in cash, and so its net debt is RM888.2m.
How Strong Is Scientex Berhad's Balance Sheet?
Zooming in on the latest balance sheet data, we can see that Scientex Berhad had liabilities of RM1.33b due within 12 months and liabilities of RM486.5m due beyond that. Offsetting these obligations, it had cash of RM123.7m as well as receivables valued at RM767.3m due within 12 months. So it has liabilities totalling RM928.9m more than its cash and near-term receivables, combined.
Given Scientex Berhad has a market capitalization of RM6.57b, it's hard to believe these liabilities pose much threat. Having said that, it's clear that we should continue to monitor its balance sheet, lest it change for the worse.
We use two main ratios to inform us about debt levels relative to earnings. The first is net debt divided by earnings before interest, tax, depreciation, and amortization (EBITDA), while the second is how many times its earnings before interest and tax (EBIT) covers its interest expense (or its interest cover, for short). The advantage of this approach is that we take into account both the absolute quantum of debt (with net debt to EBITDA) and the actual interest expenses associated with that debt (with its interest cover ratio).
Scientex Berhad has a low net debt to EBITDA ratio of only 1.3. And its EBIT covers its interest expense a whopping 54.3 times over. So we're pretty relaxed about its super-conservative use of debt. Fortunately, Scientex Berhad grew its EBIT by 6.2% in the last year, making that debt load look even more manageable. There's no doubt that we learn most about debt from the balance sheet. But ultimately the future profitability of the business will decide if Scientex Berhad can strengthen its balance sheet over time. So if you're focused on the future you can check out this free report showing analyst profit forecasts.
Finally, a business needs free cash flow to pay off debt; accounting profits just don't cut it. So it's worth checking how much of that EBIT is backed by free cash flow. Over the last three years, Scientex Berhad recorded free cash flow worth a fulsome 99% of its EBIT, which is stronger than we'd usually expect. That puts it in a very strong position to pay down debt.
Our View
The good news is that Scientex Berhad's demonstrated ability to cover its interest expense with its EBIT delights us like a fluffy puppy does a toddler. And the good news does not stop there, as its conversion of EBIT to free cash flow also supports that impression! Looking at the bigger picture, we think Scientex Berhad's use of debt seems quite reasonable and we're not concerned about it. After all, sensible leverage can boost returns on equity. Over time, share prices tend to follow earnings per share, so if you're interested in Scientex Berhad, you may well want to click here to check an interactive graph of its earnings per share history.
Of course, if you're the type of investor who prefers buying stocks without the burden of debt, then don't hesitate to discover our exclusive list of net cash growth stocks, today.
If you're looking for stocks to buy, use the lowest-cost* platform that is rated #1 Overall by Barron’s, Interactive Brokers. Trade stocks, options, futures, forex, bonds and funds on 135 markets, all from a single integrated account. Promoted
New: Manage All Your Stock Portfolios in One Place
We've created the ultimate portfolio companion for stock investors, and it's free.
• Connect an unlimited number of Portfolios and see your total in one currency
• Be alerted to new Warning Signs or Risks via email or mobile
• Track the Fair Value of your stocks
This article by Simply Wall St is general in nature. It does not constitute a recommendation to buy or sell any stock, and does not take account of your objectives, or your financial situation. We aim to bring you long-term focused analysis driven by fundamental data. Note that our analysis may not factor in the latest price-sensitive company announcements or qualitative material. Simply Wall St has no position in any stocks mentioned.
*Interactive Brokers Rated Lowest Cost Broker by StockBrokers.com Annual Online Review 2020
Have feedback on this article? Concerned about the content? Get in touch with us directly. Alternatively, email editorial-team (at) simplywallst.com.
About KLSE:SCIENTX
Scientex Berhad
An investment holding company, manufactures, markets, and sells stretch films and various flexible plastic packaging (FPP) products.
Undervalued with adequate balance sheet and pays a dividend.
Market Insights

Advertisement
Community Narratives
MicroVision will explode future revenue by 380.37% with a vision towards success
Fair Value US$60.00|98.4% undervalued
TH
Community Contributor
The Indispensable Artery for a New North American Economy
Fair Value CA$132.87|1.3% undervalued
TI
Community Contributor