
Advertisement
- Malaysia
- /
- Healthcare Services
- /
- KLSE:G3
Slammed 33% G3 Global Berhad (KLSE:G3) Screens Well Here But There Might Be A Catch
G3 Global Berhad (KLSE:G3) shareholders that were waiting for something to happen have been dealt a blow with a 33% share price drop in the last month. The recent drop completes a disastrous twelve months for shareholders, who are sitting on a 60% loss during that time.
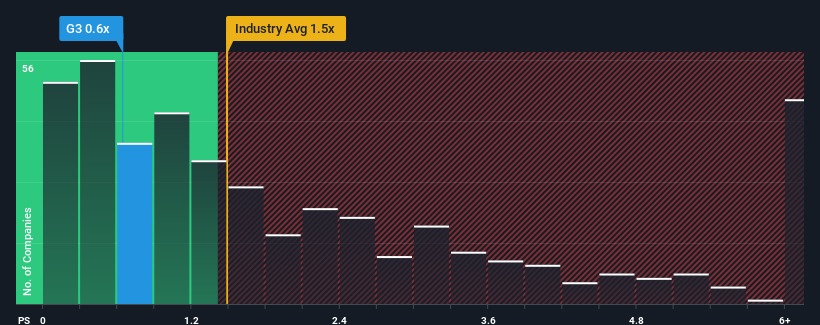
Since its price has dipped substantially, when around half the companies operating in Malaysia's Healthcare industry have price-to-sales ratios (or "P/S") above 2.7x, you may consider G3 Global Berhad as an incredibly enticing stock to check out with its 0.6x P/S ratio. Nonetheless, we'd need to dig a little deeper to determine if there is a rational basis for the highly reduced P/S.
See our latest analysis for G3 Global Berhad
How G3 Global Berhad Has Been Performing
For example, consider that G3 Global Berhad's financial performance has been poor lately as its revenue has been in decline. Perhaps the market believes the recent revenue performance isn't good enough to keep up the industry, causing the P/S ratio to suffer. If you like the company, you'd be hoping this isn't the case so that you could potentially pick up some stock while it's out of favour.
Although there are no analyst estimates available for G3 Global Berhad, take a look at this free data-rich visualisation to see how the company stacks up on earnings, revenue and cash flow.What Are Revenue Growth Metrics Telling Us About The Low P/S?
G3 Global Berhad's P/S ratio would be typical for a company that's expected to deliver very poor growth or even falling revenue, and importantly, perform much worse than the industry.
In reviewing the last year of financials, we were disheartened to see the company's revenues fell to the tune of 21%. However, a few very strong years before that means that it was still able to grow revenue by an impressive 149% in total over the last three years. So we can start by confirming that the company has generally done a very good job of growing revenue over that time, even though it had some hiccups along the way.
Comparing that to the industry, which is only predicted to deliver 8.0% growth in the next 12 months, the company's momentum is stronger based on recent medium-term annualised revenue results.
In light of this, it's peculiar that G3 Global Berhad's P/S sits below the majority of other companies. It looks like most investors are not convinced the company can maintain its recent growth rates.
The Final Word
Shares in G3 Global Berhad have plummeted and its P/S has followed suit. Generally, our preference is to limit the use of the price-to-sales ratio to establishing what the market thinks about the overall health of a company.
We're very surprised to see G3 Global Berhad currently trading on a much lower than expected P/S since its recent three-year growth is higher than the wider industry forecast. When we see robust revenue growth that outpaces the industry, we presume that there are notable underlying risks to the company's future performance, which is exerting downward pressure on the P/S ratio. It appears many are indeed anticipating revenue instability, because the persistence of these recent medium-term conditions would normally provide a boost to the share price.
It is also worth noting that we have found 2 warning signs for G3 Global Berhad that you need to take into consideration.
It's important to make sure you look for a great company, not just the first idea you come across. So if growing profitability aligns with your idea of a great company, take a peek at this free list of interesting companies with strong recent earnings growth (and a low P/E).
New: Manage All Your Stock Portfolios in One Place
We've created the ultimate portfolio companion for stock investors, and it's free.
• Connect an unlimited number of Portfolios and see your total in one currency
• Be alerted to new Warning Signs or Risks via email or mobile
• Track the Fair Value of your stocks
Have feedback on this article? Concerned about the content? Get in touch with us directly. Alternatively, email editorial-team (at) simplywallst.com.
This article by Simply Wall St is general in nature. We provide commentary based on historical data and analyst forecasts only using an unbiased methodology and our articles are not intended to be financial advice. It does not constitute a recommendation to buy or sell any stock, and does not take account of your objectives, or your financial situation. We aim to bring you long-term focused analysis driven by fundamental data. Note that our analysis may not factor in the latest price-sensitive company announcements or qualitative material. Simply Wall St has no position in any stocks mentioned.
About KLSE:G3
G3 Global Berhad
An investment holding company, provides information and communication technology services in Malaysia.
Flawless balance sheet with very low risk.
Similar Companies
Market Insights

Advertisement
Community Narratives
The company that turned a verb into a global necessity and basically runs the modern internet, digital ads, smartphones, maps, and AI.
Fair Value US$300.00|6.3% undervalued
OS
Community Contributor
Flowers Foods Pays A Fair Price For Health
Fair Value US$16.12|26.0% undervalued
NV
Community Contributor
TMX Group will thrive with 33.3% profit margin and enduring market moat
Fair Value CA$49.90|3.7% overvalued
LI
Community Contributor