
Advertisement
- Malaysia
- /
- Healthcare Services
- /
- KLSE:G3
G3 Global Berhad (KLSE:G3) Stock's 38% Dive Might Signal An Opportunity But It Requires Some Scrutiny
G3 Global Berhad (KLSE:G3) shareholders won't be pleased to see that the share price has had a very rough month, dropping 38% and undoing the prior period's positive performance. To make matters worse, the recent drop has wiped out a year's worth of gains with the share price now back where it started a year ago.
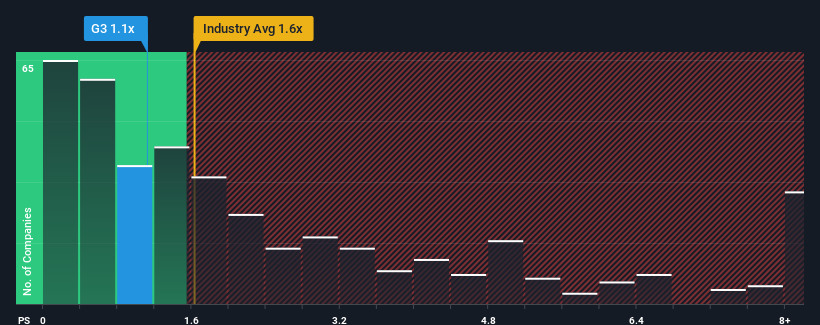
Since its price has dipped substantially, given about half the companies operating in Malaysia's Healthcare industry have price-to-sales ratios (or "P/S") above 2.9x, you may consider G3 Global Berhad as an attractive investment with its 1.1x P/S ratio. Although, it's not wise to just take the P/S at face value as there may be an explanation why it's limited.
See our latest analysis for G3 Global Berhad
How G3 Global Berhad Has Been Performing
Recent times have been quite advantageous for G3 Global Berhad as its revenue has been rising very briskly. One possibility is that the P/S ratio is low because investors think this strong revenue growth might actually underperform the broader industry in the near future. Those who are bullish on G3 Global Berhad will be hoping that this isn't the case, so that they can pick up the stock at a lower valuation.
Want the full picture on earnings, revenue and cash flow for the company? Then our free report on G3 Global Berhad will help you shine a light on its historical performance.What Are Revenue Growth Metrics Telling Us About The Low P/S?
G3 Global Berhad's P/S ratio would be typical for a company that's only expected to deliver limited growth, and importantly, perform worse than the industry.
Retrospectively, the last year delivered an exceptional 137% gain to the company's top line. The latest three year period has also seen an incredible overall rise in revenue, aided by its incredible short-term performance. Accordingly, shareholders would have been over the moon with those medium-term rates of revenue growth.
This is in contrast to the rest of the industry, which is expected to grow by 5.9% over the next year, materially lower than the company's recent medium-term annualised growth rates.
With this information, we find it odd that G3 Global Berhad is trading at a P/S lower than the industry. Apparently some shareholders believe the recent performance has exceeded its limits and have been accepting significantly lower selling prices.
What Does G3 Global Berhad's P/S Mean For Investors?
The southerly movements of G3 Global Berhad's shares means its P/S is now sitting at a pretty low level. While the price-to-sales ratio shouldn't be the defining factor in whether you buy a stock or not, it's quite a capable barometer of revenue expectations.
We're very surprised to see G3 Global Berhad currently trading on a much lower than expected P/S since its recent three-year growth is higher than the wider industry forecast. Potential investors that are sceptical over continued revenue performance may be preventing the P/S ratio from matching previous strong performance. It appears many are indeed anticipating revenue instability, because the persistence of these recent medium-term conditions would normally provide a boost to the share price.
Don't forget that there may be other risks. For instance, we've identified 2 warning signs for G3 Global Berhad (1 is significant) you should be aware of.
If you're unsure about the strength of G3 Global Berhad's business, why not explore our interactive list of stocks with solid business fundamentals for some other companies you may have missed.
New: Manage All Your Stock Portfolios in One Place
We've created the ultimate portfolio companion for stock investors, and it's free.
• Connect an unlimited number of Portfolios and see your total in one currency
• Be alerted to new Warning Signs or Risks via email or mobile
• Track the Fair Value of your stocks
Have feedback on this article? Concerned about the content? Get in touch with us directly. Alternatively, email editorial-team (at) simplywallst.com.
This article by Simply Wall St is general in nature. We provide commentary based on historical data and analyst forecasts only using an unbiased methodology and our articles are not intended to be financial advice. It does not constitute a recommendation to buy or sell any stock, and does not take account of your objectives, or your financial situation. We aim to bring you long-term focused analysis driven by fundamental data. Note that our analysis may not factor in the latest price-sensitive company announcements or qualitative material. Simply Wall St has no position in any stocks mentioned.
About KLSE:G3
G3 Global Berhad
An investment holding company, provides information and communication technology services in Malaysia.
Flawless balance sheet with very low risk.
Similar Companies
Market Insights

Advertisement
Community Narratives
The company that turned a verb into a global necessity and basically runs the modern internet, digital ads, smartphones, maps, and AI.
Fair Value US$300.00|6.3% undervalued
OS
Community Contributor
Flowers Foods Pays A Fair Price For Health
Fair Value US$16.12|26.0% undervalued
NV
Community Contributor
TMX Group will thrive with 33.3% profit margin and enduring market moat
Fair Value CA$49.90|3.7% overvalued
LI
Community Contributor