
Advertisement
- Malaysia
- /
- Energy Services
- /
- KLSE:LFG
Lianson Fleet Group Berhad's (KLSE:LFG) P/S Is Still On The Mark Following 53% Share Price Bounce
Lianson Fleet Group Berhad (KLSE:LFG) shares have continued their recent momentum with a 53% gain in the last month alone. The last 30 days bring the annual gain to a very sharp 50%.
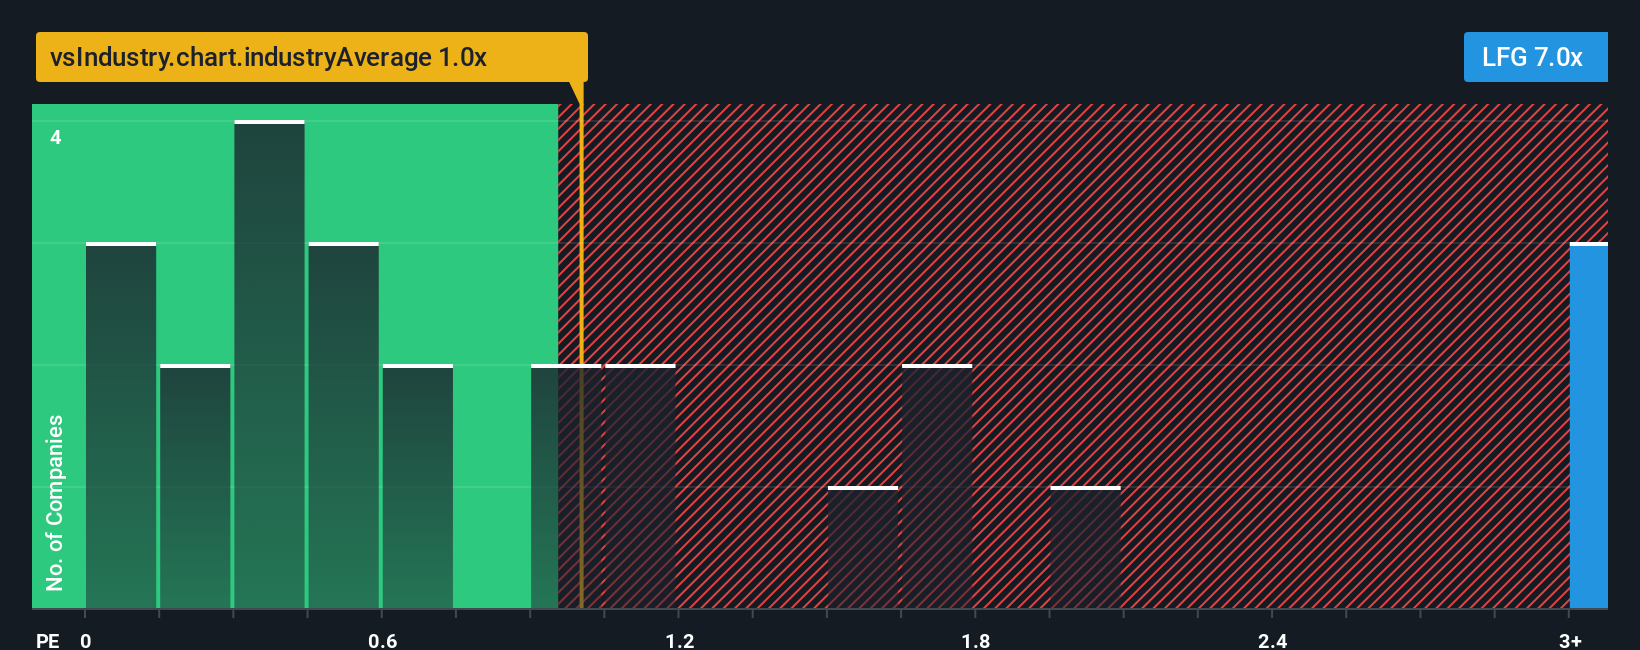
Since its price has surged higher, you could be forgiven for thinking Lianson Fleet Group Berhad is a stock to steer clear of with a price-to-sales ratios (or "P/S") of 7x, considering almost half the companies in Malaysia's Energy Services industry have P/S ratios below 1x. Nonetheless, we'd need to dig a little deeper to determine if there is a rational basis for the highly elevated P/S.
View our latest analysis for Lianson Fleet Group Berhad
How Has Lianson Fleet Group Berhad Performed Recently?
With its revenue growth in positive territory compared to the declining revenue of most other companies, Lianson Fleet Group Berhad has been doing quite well of late. The P/S ratio is probably high because investors think the company will continue to navigate the broader industry headwinds better than most. However, if this isn't the case, investors might get caught out paying too much for the stock.
Want the full picture on analyst estimates for the company? Then our free report on Lianson Fleet Group Berhad will help you uncover what's on the horizon.Do Revenue Forecasts Match The High P/S Ratio?
The only time you'd be truly comfortable seeing a P/S as steep as Lianson Fleet Group Berhad's is when the company's growth is on track to outshine the industry decidedly.
Taking a look back first, we see that the company grew revenue by an impressive 40% last year. However, this wasn't enough as the latest three year period has seen the company endure a nasty 17% drop in revenue in aggregate. So unfortunately, we have to acknowledge that the company has not done a great job of growing revenues over that time.
Turning to the outlook, the next year should demonstrate the company's robustness, generating growth of 23% as estimated by the one analyst watching the company. Meanwhile, the broader industry is forecast to contract by 4.5%, which would indicate the company is doing very well.
In light of this, it's understandable that Lianson Fleet Group Berhad's P/S sits above the majority of other companies. Right now, investors are willing to pay more for a stock that is shaping up to buck the trend of the broader industry going backwards.
What Does Lianson Fleet Group Berhad's P/S Mean For Investors?
Shares in Lianson Fleet Group Berhad have seen a strong upwards swing lately, which has really helped boost its P/S figure. Using the price-to-sales ratio alone to determine if you should sell your stock isn't sensible, however it can be a practical guide to the company's future prospects.
As we suspected, our examination of Lianson Fleet Group Berhad's analyst forecasts revealed that its superior revenue outlook against a shaky industry is contributing to its high P/S. Outperforming the industry in this manner looks to have provided investors with a bit of confidence that the future will be bright, bolstering the P/S. Questions could still raised over whether this level of outperformance can continue in the context of a a tumultuous industry climate. Otherwise, it's hard to see the share price falling strongly in the near future under the current growth expectations.
We don't want to rain on the parade too much, but we did also find 1 warning sign for Lianson Fleet Group Berhad that you need to be mindful of.
If strong companies turning a profit tickle your fancy, then you'll want to check out this free list of interesting companies that trade on a low P/E (but have proven they can grow earnings).
New: AI Stock Screener & Alerts
Our new AI Stock Screener scans the market every day to uncover opportunities.
• Dividend Powerhouses (3%+ Yield)
• Undervalued Small Caps with Insider Buying
• High growth Tech and AI Companies
Or build your own from over 50 metrics.
Have feedback on this article? Concerned about the content? Get in touch with us directly. Alternatively, email editorial-team (at) simplywallst.com.
This article by Simply Wall St is general in nature. We provide commentary based on historical data and analyst forecasts only using an unbiased methodology and our articles are not intended to be financial advice. It does not constitute a recommendation to buy or sell any stock, and does not take account of your objectives, or your financial situation. We aim to bring you long-term focused analysis driven by fundamental data. Note that our analysis may not factor in the latest price-sensitive company announcements or qualitative material. Simply Wall St has no position in any stocks mentioned.
About KLSE:LFG
Lianson Fleet Group Berhad
An investment holding company, provides vessel chartering, ship management, and offshore marine services to the oil and gas related industries in Malaysia and Brunei.
Flawless balance sheet with acceptable track record.
Market Insights

Advertisement
Community Narratives
The "Molecular Pencil": Why Beam's Technology is Built to Win
Fair Value US$65.01|65.4% undervalued
DA
Community Contributor
The silent giant behind virtually every advanced chip powering AI, smartphones, and modern infrastructure.
Fair Value US$310.00|6.1% undervalued
OS
Community Contributor
ADP Stock: Solid Fundamentals, But AI Investments Test Its Margin Resilience
Fair Value US$387.77|34.2% undervalued
YI
Community Contributor
MINISO's fair value is projected at 26.69 with an anticipated PE ratio shift of 20x
Fair Value US$24.03|9.6% undervalued
BE
Community Contributor