
Advertisement
Some say volatility, rather than debt, is the best way to think about risk as an investor, but Warren Buffett famously said that 'Volatility is far from synonymous with risk.' So it might be obvious that you need to consider debt, when you think about how risky any given stock is, because too much debt can sink a company. We can see that Avillion Berhad (KLSE:AVI) does use debt in its business. But is this debt a concern to shareholders?
When Is Debt Dangerous?
Debt assists a business until the business has trouble paying it off, either with new capital or with free cash flow. If things get really bad, the lenders can take control of the business. However, a more common (but still painful) scenario is that it has to raise new equity capital at a low price, thus permanently diluting shareholders. Having said that, the most common situation is where a company manages its debt reasonably well - and to its own advantage. When we think about a company's use of debt, we first look at cash and debt together.
Check out our latest analysis for Avillion Berhad
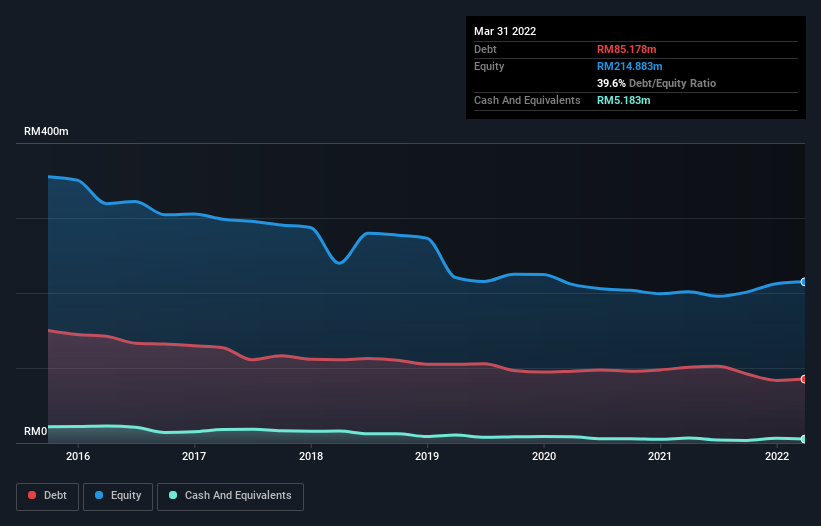
How Much Debt Does Avillion Berhad Carry?
The image below, which you can click on for greater detail, shows that Avillion Berhad had debt of RM85.2m at the end of March 2022, a reduction from RM101.0m over a year. However, it also had RM5.18m in cash, and so its net debt is RM80.0m.
A Look At Avillion Berhad's Liabilities
We can see from the most recent balance sheet that Avillion Berhad had liabilities of RM58.5m falling due within a year, and liabilities of RM88.9m due beyond that. On the other hand, it had cash of RM5.18m and RM7.58m worth of receivables due within a year. So its liabilities outweigh the sum of its cash and (near-term) receivables by RM134.7m.
When you consider that this deficiency exceeds the company's RM90.7m market capitalization, you might well be inclined to review the balance sheet intently. Hypothetically, extremely heavy dilution would be required if the company were forced to pay down its liabilities by raising capital at the current share price. When analysing debt levels, the balance sheet is the obvious place to start. But you can't view debt in total isolation; since Avillion Berhad will need earnings to service that debt. So if you're keen to discover more about its earnings, it might be worth checking out this graph of its long term earnings trend.
In the last year Avillion Berhad wasn't profitable at an EBIT level, but managed to grow its revenue by 54%, to RM32m. With any luck the company will be able to grow its way to profitability.
Caveat Emptor
Despite the top line growth, Avillion Berhad still had an earnings before interest and tax (EBIT) loss over the last year. To be specific the EBIT loss came in at RM5.8m. When we look at that alongside the significant liabilities, we're not particularly confident about the company. It would need to improve its operations quickly for us to be interested in it. Not least because it had negative free cash flow of RM4.1m over the last twelve months. That means it's on the risky side of things. There's no doubt that we learn most about debt from the balance sheet. However, not all investment risk resides within the balance sheet - far from it. These risks can be hard to spot. Every company has them, and we've spotted 3 warning signs for Avillion Berhad (of which 1 shouldn't be ignored!) you should know about.
At the end of the day, it's often better to focus on companies that are free from net debt. You can access our special list of such companies (all with a track record of profit growth). It's free.
New: Manage All Your Stock Portfolios in One Place
We've created the ultimate portfolio companion for stock investors, and it's free.
• Connect an unlimited number of Portfolios and see your total in one currency
• Be alerted to new Warning Signs or Risks via email or mobile
• Track the Fair Value of your stocks
Have feedback on this article? Concerned about the content? Get in touch with us directly. Alternatively, email editorial-team (at) simplywallst.com.
This article by Simply Wall St is general in nature. We provide commentary based on historical data and analyst forecasts only using an unbiased methodology and our articles are not intended to be financial advice. It does not constitute a recommendation to buy or sell any stock, and does not take account of your objectives, or your financial situation. We aim to bring you long-term focused analysis driven by fundamental data. Note that our analysis may not factor in the latest price-sensitive company announcements or qualitative material. Simply Wall St has no position in any stocks mentioned.
About KLSE:AVI
Avillion Berhad
An investment holding company, engages in the hotel, property, and travel businesses in Malaysia, Hong Kong, Singapore, and Indonesia.
Flawless balance sheet and fair value.
Market Insights

Advertisement
Community Narratives
MicroVision will explode future revenue by 380.37% with a vision towards success
Fair Value US$60|98.4% undervalued
TH
Community Contributor
The Indispensable Artery for a New North American Economy
Fair Value CA$132.87|1.6% undervalued
TI
Community Contributor
Recently Updated Narratives
BE


Bejgal on MINISO Group Holding ·
MINISO's fair value is projected at 26.69 with an anticipated PE ratio shift of 20x
Fair Value:US$26.6928.0% undervalued
44 followersusers have followed this narrative
3 commentsusers have commented on this narrative
0 likesusers have liked this narrative
TI


TickerTickle on Oracle ·
The Quiet Giant That Became AI’s Power Grid
Fair Value:US$389.8149.5% undervalued
6 followersusers have followed this narrative
0 commentsusers have commented on this narrative
0 likesusers have liked this narrative
AU

AuCA on Nova Ljubljanska Banka d.d ·
Nova Ljubljanska Banka d.d will expect a 11.2% revenue boost driving future growth
Fair Value:€20916.3% undervalued
23 followersusers have followed this narrative
3 commentsusers have commented on this narrative
0 likesusers have liked this narrative
Popular Narratives
OS


oscargarcia on Alphabet ·
The company that turned a verb into a global necessity and basically runs the modern internet, digital ads, smartphones, maps, and AI.
Fair Value:US$3404.9% undervalued
134 followersusers have followed this narrative
6 commentsusers have commented on this narrative
18 likesusers have liked this narrative
TH

TheWallstreetKing on MicroVision ·
MicroVision will explode future revenue by 380.37% with a vision towards success
Fair Value:US$6098.4% undervalued
82 followersusers have followed this narrative
10 commentsusers have commented on this narrative
18 likesusers have liked this narrative
AN


AnalystConsensusTarget on NVIDIA ·
NVDA: Expanding AI Demand Will Drive Major Data Center Investments Through 2026
Fair Value:US$232.7923.6% undervalued
919 followersusers have followed this narrative
5 commentsusers have commented on this narrative
21 likesusers have liked this narrative