Stock Analysis
- Malaysia
- /
- Professional Services
- /
- KLSE:MYEG
My E.G. Services Berhad's (KLSE:MYEG) earnings growth rate lags the 35% return delivered to shareholders


Passive investing in index funds can generate returns that roughly match the overall market. But investors can boost returns by picking market-beating companies to own shares in. To wit, the My E.G. Services Berhad (KLSE:MYEG) share price is 33% higher than it was a year ago, much better than the market return of around 18% (not including dividends) in the same period. So that should have shareholders smiling. However, the stock hasn't done so well in the longer term, with the stock only up 18% in three years.
Since the long term performance has been good but there's been a recent pullback of 3.8%, let's check if the fundamentals match the share price.
Check out our latest analysis for My E.G. Services Berhad
To paraphrase Benjamin Graham: Over the short term the market is a voting machine, but over the long term it's a weighing machine. One flawed but reasonable way to assess how sentiment around a company has changed is to compare the earnings per share (EPS) with the share price.
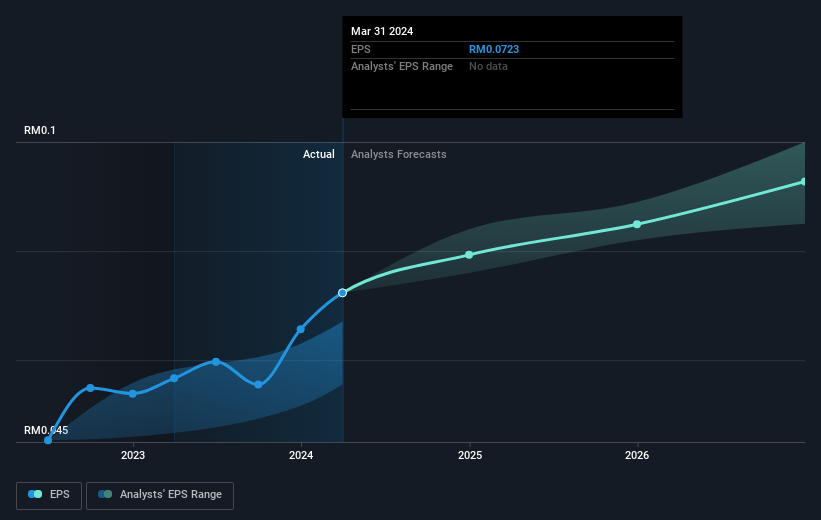
During the last year My E.G. Services Berhad grew its earnings per share (EPS) by 28%. We note that the earnings per share growth isn't far from the share price growth (of 33%). This makes us think the market hasn't really changed its sentiment around the company, in the last year. It looks like the share price is responding to the EPS.
The image below shows how EPS has tracked over time (if you click on the image you can see greater detail).
We're pleased to report that the CEO is remunerated more modestly than most CEOs at similarly capitalized companies. But while CEO remuneration is always worth checking, the really important question is whether the company can grow earnings going forward. It might be well worthwhile taking a look at our free report on My E.G. Services Berhad's earnings, revenue and cash flow.
What About Dividends?
As well as measuring the share price return, investors should also consider the total shareholder return (TSR). Whereas the share price return only reflects the change in the share price, the TSR includes the value of dividends (assuming they were reinvested) and the benefit of any discounted capital raising or spin-off. Arguably, the TSR gives a more comprehensive picture of the return generated by a stock. In the case of My E.G. Services Berhad, it has a TSR of 35% for the last 1 year. That exceeds its share price return that we previously mentioned. This is largely a result of its dividend payments!
A Different Perspective
We're pleased to report that My E.G. Services Berhad shareholders have received a total shareholder return of 35% over one year. That's including the dividend. That gain is better than the annual TSR over five years, which is 7%. Therefore it seems like sentiment around the company has been positive lately. Given the share price momentum remains strong, it might be worth taking a closer look at the stock, lest you miss an opportunity. I find it very interesting to look at share price over the long term as a proxy for business performance. But to truly gain insight, we need to consider other information, too. Even so, be aware that My E.G. Services Berhad is showing 1 warning sign in our investment analysis , you should know about...
If you would prefer to check out another company -- one with potentially superior financials -- then do not miss this free list of companies that have proven they can grow earnings.
Please note, the market returns quoted in this article reflect the market weighted average returns of stocks that currently trade on Malaysian exchanges.
New: Manage All Your Stock Portfolios in One Place
We've created the ultimate portfolio companion for stock investors, and it's free.
• Connect an unlimited number of Portfolios and see your total in one currency
• Be alerted to new Warning Signs or Risks via email or mobile
• Track the Fair Value of your stocks
Have feedback on this article? Concerned about the content? Get in touch with us directly. Alternatively, email editorial-team (at) simplywallst.com.
This article by Simply Wall St is general in nature. We provide commentary based on historical data and analyst forecasts only using an unbiased methodology and our articles are not intended to be financial advice. It does not constitute a recommendation to buy or sell any stock, and does not take account of your objectives, or your financial situation. We aim to bring you long-term focused analysis driven by fundamental data. Note that our analysis may not factor in the latest price-sensitive company announcements or qualitative material. Simply Wall St has no position in any stocks mentioned.
Have feedback on this article? Concerned about the content? Get in touch with us directly. Alternatively, email editorial-team@simplywallst.com
About KLSE:MYEG
My E.G. Services Berhad
An investment holding company, develops and implements electronic government services project, and provides other related services in Malaysia and internationally.
Very undervalued with outstanding track record.
