
Advertisement
- Malaysia
- /
- Industrials
- /
- KLSE:WARISAN
There's No Escaping Warisan TC Holdings Berhad's (KLSE:WARISAN) Muted Revenues Despite A 39% Share Price Rise

Warisan TC Holdings Berhad (KLSE:WARISAN) shares have had a really impressive month, gaining 39% after a shaky period beforehand. Looking back a bit further, it's encouraging to see the stock is up 39% in the last year.
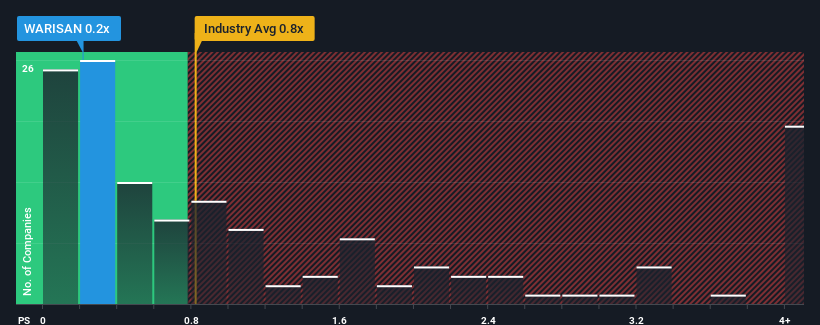
Although its price has surged higher, Warisan TC Holdings Berhad's price-to-sales (or "P/S") ratio of 0.2x might still make it look like a buy right now compared to the Industrials industry in Malaysia, where around half of the companies have P/S ratios above 0.9x and even P/S above 3x are quite common. Although, it's not wise to just take the P/S at face value as there may be an explanation why it's limited.
View our latest analysis for Warisan TC Holdings Berhad
What Does Warisan TC Holdings Berhad's P/S Mean For Shareholders?
For example, consider that Warisan TC Holdings Berhad's financial performance has been poor lately as its revenue has been in decline. Perhaps the market believes the recent revenue performance isn't good enough to keep up the industry, causing the P/S ratio to suffer. However, if this doesn't eventuate then existing shareholders may be feeling optimistic about the future direction of the share price.
We don't have analyst forecasts, but you can see how recent trends are setting up the company for the future by checking out our free report on Warisan TC Holdings Berhad's earnings, revenue and cash flow.Do Revenue Forecasts Match The Low P/S Ratio?
There's an inherent assumption that a company should underperform the industry for P/S ratios like Warisan TC Holdings Berhad's to be considered reasonable.
Taking a look back first, the company's revenue growth last year wasn't something to get excited about as it posted a disappointing decline of 5.9%. However, a few very strong years before that means that it was still able to grow revenue by an impressive 43% in total over the last three years. So we can start by confirming that the company has generally done a very good job of growing revenue over that time, even though it had some hiccups along the way.
This is in contrast to the rest of the industry, which is expected to grow by 70% over the next year, materially higher than the company's recent medium-term annualised growth rates.
In light of this, it's understandable that Warisan TC Holdings Berhad's P/S sits below the majority of other companies. Apparently many shareholders weren't comfortable holding on to something they believe will continue to trail the wider industry.
What Does Warisan TC Holdings Berhad's P/S Mean For Investors?
The latest share price surge wasn't enough to lift Warisan TC Holdings Berhad's P/S close to the industry median. We'd say the price-to-sales ratio's power isn't primarily as a valuation instrument but rather to gauge current investor sentiment and future expectations.
In line with expectations, Warisan TC Holdings Berhad maintains its low P/S on the weakness of its recent three-year growth being lower than the wider industry forecast. At this stage investors feel the potential for an improvement in revenue isn't great enough to justify a higher P/S ratio. Unless the recent medium-term conditions improve, they will continue to form a barrier for the share price around these levels.
Having said that, be aware Warisan TC Holdings Berhad is showing 1 warning sign in our investment analysis, you should know about.
If strong companies turning a profit tickle your fancy, then you'll want to check out this free list of interesting companies that trade on a low P/E (but have proven they can grow earnings).
Valuation is complex, but we're here to simplify it.
Discover if Warisan TC Holdings Berhad might be undervalued or overvalued with our detailed analysis, featuring fair value estimates, potential risks, dividends, insider trades, and its financial condition.
Access Free AnalysisHave feedback on this article? Concerned about the content? Get in touch with us directly. Alternatively, email editorial-team (at) simplywallst.com.
This article by Simply Wall St is general in nature. We provide commentary based on historical data and analyst forecasts only using an unbiased methodology and our articles are not intended to be financial advice. It does not constitute a recommendation to buy or sell any stock, and does not take account of your objectives, or your financial situation. We aim to bring you long-term focused analysis driven by fundamental data. Note that our analysis may not factor in the latest price-sensitive company announcements or qualitative material. Simply Wall St has no position in any stocks mentioned.
About KLSE:WARISAN
Warisan TC Holdings Berhad
An investment holding company, provides travel and car rental, automotive, machinery, and consumer products and services in Malaysia.
Good value with mediocre balance sheet.
Market Insights

Advertisement
Community Narratives
The Future of Drug Testing? Fingerprint Tech Shows Serious Promise
Fair Value US$2.98|35.9% undervalued
JO
Community Contributor
Occidental Petroleum is set to achieve a 16% profit margin improvement
Fair Value US$55.05|15.6% undervalued
DZ
Community Contributor
Argan's Revenue Set to Soar with a 13.31% Growth in the Coming Decade
Fair Value US$284.68|23.4% undervalued
KE
Community Contributor
EU#1 - From German Startup to EU’s Biggest Company
Fair Value €248.62|2.5% overvalued
TO
Community Contributor