
Advertisement
- Malaysia
- /
- Trade Distributors
- /
- KLSE:PASUKGB
Pasukhas Group Berhad's (KLSE:PASUKGB) 27% Dip Still Leaving Some Shareholders Feeling Restless Over Its P/SRatio

Unfortunately for some shareholders, the Pasukhas Group Berhad (KLSE:PASUKGB) share price has dived 27% in the last thirty days, prolonging recent pain. For any long-term shareholders, the last month ends a year to forget by locking in a 52% share price decline.
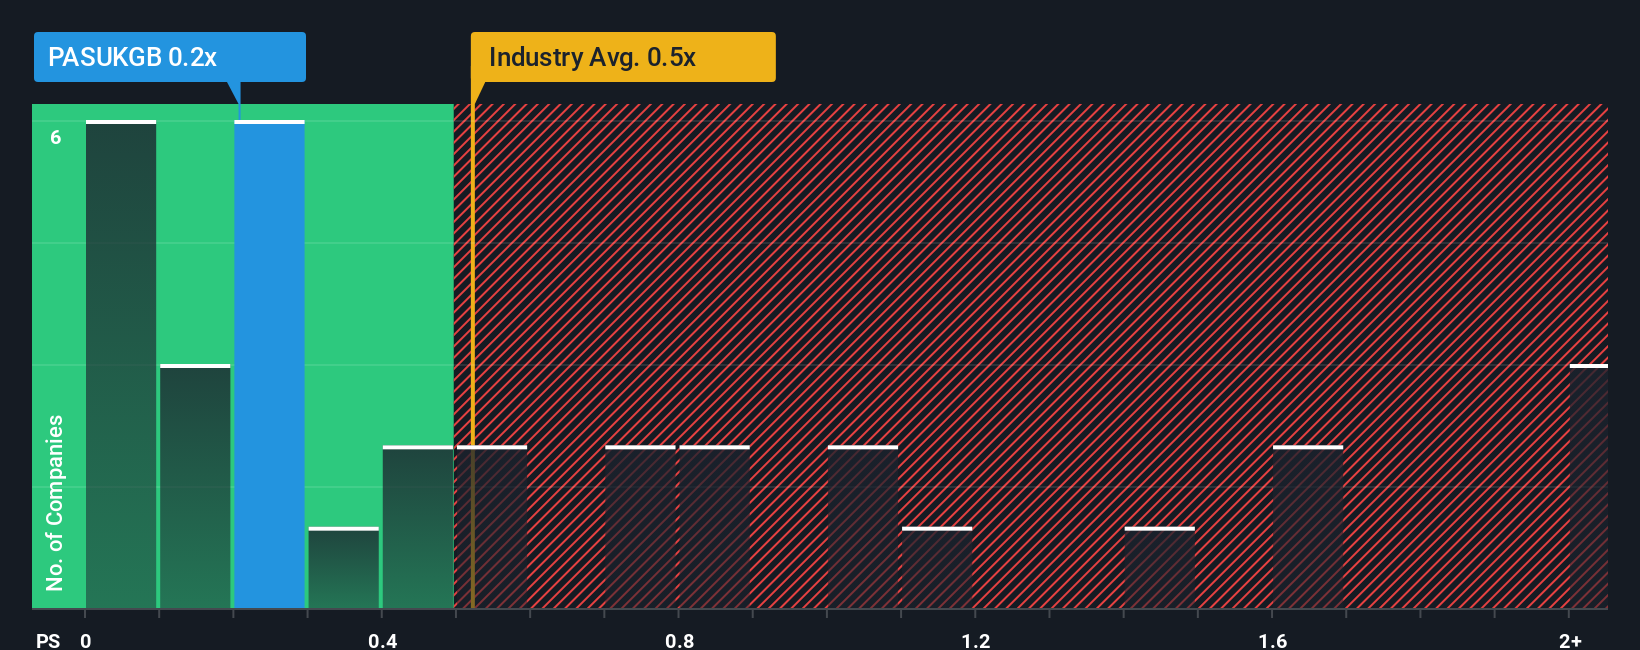
Although its price has dipped substantially, there still wouldn't be many who think Pasukhas Group Berhad's price-to-sales (or "P/S") ratio of 0.2x is worth a mention when the median P/S in Malaysia's Trade Distributors industry is similar at about 0.5x. However, investors might be overlooking a clear opportunity or potential setback if there is no rational basis for the P/S.
View our latest analysis for Pasukhas Group Berhad
What Does Pasukhas Group Berhad's P/S Mean For Shareholders?
As an illustration, revenue has deteriorated at Pasukhas Group Berhad over the last year, which is not ideal at all. Perhaps investors believe the recent revenue performance is enough to keep in line with the industry, which is keeping the P/S from dropping off. If you like the company, you'd at least be hoping this is the case so that you could potentially pick up some stock while it's not quite in favour.
Although there are no analyst estimates available for Pasukhas Group Berhad, take a look at this free data-rich visualisation to see how the company stacks up on earnings, revenue and cash flow.What Are Revenue Growth Metrics Telling Us About The P/S?
Pasukhas Group Berhad's P/S ratio would be typical for a company that's only expected to deliver moderate growth, and importantly, perform in line with the industry.
Retrospectively, the last year delivered a frustrating 6.5% decrease to the company's top line. As a result, revenue from three years ago have also fallen 4.4% overall. Therefore, it's fair to say the revenue growth recently has been undesirable for the company.
Comparing that to the industry, which is predicted to deliver 11% growth in the next 12 months, the company's downward momentum based on recent medium-term revenue results is a sobering picture.
With this in mind, we find it worrying that Pasukhas Group Berhad's P/S exceeds that of its industry peers. Apparently many investors in the company are way less bearish than recent times would indicate and aren't willing to let go of their stock right now. Only the boldest would assume these prices are sustainable as a continuation of recent revenue trends is likely to weigh on the share price eventually.
The Key Takeaway
Pasukhas Group Berhad's plummeting stock price has brought its P/S back to a similar region as the rest of the industry. It's argued the price-to-sales ratio is an inferior measure of value within certain industries, but it can be a powerful business sentiment indicator.
The fact that Pasukhas Group Berhad currently trades at a P/S on par with the rest of the industry is surprising to us since its recent revenues have been in decline over the medium-term, all while the industry is set to grow. When we see revenue heading backwards in the context of growing industry forecasts, it'd make sense to expect a possible share price decline on the horizon, sending the moderate P/S lower. Unless the recent medium-term conditions improve markedly, investors will have a hard time accepting the share price as fair value.
Before you take the next step, you should know about the 3 warning signs for Pasukhas Group Berhad (2 make us uncomfortable!) that we have uncovered.
If these risks are making you reconsider your opinion on Pasukhas Group Berhad, explore our interactive list of high quality stocks to get an idea of what else is out there.
New: Manage All Your Stock Portfolios in One Place
We've created the ultimate portfolio companion for stock investors, and it's free.
• Connect an unlimited number of Portfolios and see your total in one currency
• Be alerted to new Warning Signs or Risks via email or mobile
• Track the Fair Value of your stocks
Have feedback on this article? Concerned about the content? Get in touch with us directly. Alternatively, email editorial-team (at) simplywallst.com.
This article by Simply Wall St is general in nature. We provide commentary based on historical data and analyst forecasts only using an unbiased methodology and our articles are not intended to be financial advice. It does not constitute a recommendation to buy or sell any stock, and does not take account of your objectives, or your financial situation. We aim to bring you long-term focused analysis driven by fundamental data. Note that our analysis may not factor in the latest price-sensitive company announcements or qualitative material. Simply Wall St has no position in any stocks mentioned.
About KLSE:PASUKGB
Pasukhas Group Berhad
An investment holding company, operates as a civil, mechanical, and electrical company serving various market segments in Malaysia.
Adequate balance sheet low.
Similar Companies
Market Insights

Advertisement
Community Narratives
Vita Life Sciences Set for a 12.72% Revenue Growth While Tackling Operational Challenges
Fair Value AU$2.42|9.5% undervalued
RO
Community Contributor
Vossloh rides a €500 billion wave to boost growth and earnings in the next decade
Fair Value €78.41|7.2% undervalued
CH
Community Contributor
Intuitive Surgical Will Transform Healthcare with 12% Revenue Growth
Fair Value US$325.55|56.5% overvalued
UN
Community Contributor