
Advertisement
- Malaysia
- /
- Construction
- /
- KLSE:MUDAJYA
We Like These Underlying Return On Capital Trends At Mudajaya Group Berhad (KLSE:MUDAJYA)
What are the early trends we should look for to identify a stock that could multiply in value over the long term? In a perfect world, we'd like to see a company investing more capital into its business and ideally the returns earned from that capital are also increasing. This shows us that it's a compounding machine, able to continually reinvest its earnings back into the business and generate higher returns. So on that note, Mudajaya Group Berhad (KLSE:MUDAJYA) looks quite promising in regards to its trends of return on capital.
Return On Capital Employed (ROCE): What is it?
If you haven't worked with ROCE before, it measures the 'return' (pre-tax profit) a company generates from capital employed in its business. Analysts use this formula to calculate it for Mudajaya Group Berhad:
Return on Capital Employed = Earnings Before Interest and Tax (EBIT) ÷ (Total Assets - Current Liabilities)
0.035 = RM23m ÷ (RM960m - RM316m) (Based on the trailing twelve months to March 2022).
So, Mudajaya Group Berhad has an ROCE of 3.5%. Ultimately, that's a low return and it under-performs the Construction industry average of 5.3%.
Check out our latest analysis for Mudajaya Group Berhad
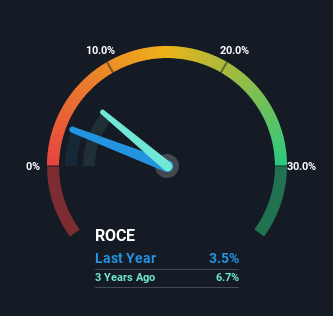
While the past is not representative of the future, it can be helpful to know how a company has performed historically, which is why we have this chart above. If you'd like to look at how Mudajaya Group Berhad has performed in the past in other metrics, you can view this free graph of past earnings, revenue and cash flow.
What Can We Tell From Mudajaya Group Berhad's ROCE Trend?
Like most people, we're pleased that Mudajaya Group Berhad is now generating some pretax earnings. Historically the company was generating losses but as we can see from the latest figures referenced above, they're now earning 3.5% on their capital employed. Additionally, the business is utilizing 42% less capital than it was five years ago, and taken at face value, that can mean the company needs less funds at work to get a return. This could potentially mean that the company is selling some of its assets.
In another part of our analysis, we noticed that the company's ratio of current liabilities to total assets decreased to 33%, which broadly means the business is relying less on its suppliers or short-term creditors to fund its operations. So this improvement in ROCE has come from the business' underlying economics, which is great to see.
What We Can Learn From Mudajaya Group Berhad's ROCE
In a nutshell, we're pleased to see that Mudajaya Group Berhad has been able to generate higher returns from less capital. And since the stock has dived 84% over the last five years, there may be other factors affecting the company's prospects. Regardless, we think the underlying fundamentals warrant this stock for further investigation.
Since virtually every company faces some risks, it's worth knowing what they are, and we've spotted 5 warning signs for Mudajaya Group Berhad (of which 2 make us uncomfortable!) that you should know about.
If you want to search for solid companies with great earnings, check out this free list of companies with good balance sheets and impressive returns on equity.
New: Manage All Your Stock Portfolios in One Place
We've created the ultimate portfolio companion for stock investors, and it's free.
• Connect an unlimited number of Portfolios and see your total in one currency
• Be alerted to new Warning Signs or Risks via email or mobile
• Track the Fair Value of your stocks
Have feedback on this article? Concerned about the content? Get in touch with us directly. Alternatively, email editorial-team (at) simplywallst.com.
This article by Simply Wall St is general in nature. We provide commentary based on historical data and analyst forecasts only using an unbiased methodology and our articles are not intended to be financial advice. It does not constitute a recommendation to buy or sell any stock, and does not take account of your objectives, or your financial situation. We aim to bring you long-term focused analysis driven by fundamental data. Note that our analysis may not factor in the latest price-sensitive company announcements or qualitative material. Simply Wall St has no position in any stocks mentioned.
About KLSE:MUDAJYA
Mudajaya Group Berhad
An investment holding company, engages in civil engineering and building construction activities in Malaysia and China.
Good value with adequate balance sheet.
Market Insights

Advertisement
Community Narratives
MicroVision will explode future revenue by 380.37% with a vision towards success
Fair Value US$60.00|98.5% undervalued
TH
Community Contributor
The Indispensable Artery for a New North American Economy
Fair Value CA$132.87|2.3% undervalued
TI
Community Contributor