Stock Analysis
- Malaysia
- /
- Industrials
- /
- KLSE:ASB
Investors bid Advance Synergy Berhad (KLSE:ASB) up RM38m despite increasing losses YoY, taking five-year CAGR to 0.4%

The main aim of stock picking is to find the market-beating stocks. But even the best stock picker will only win with some selections. So we wouldn't blame long term Advance Synergy Berhad (KLSE:ASB) shareholders for doubting their decision to hold, with the stock down 20% over a half decade.
On a more encouraging note the company has added RM38m to its market cap in just the last 7 days, so let's see if we can determine what's driven the five-year loss for shareholders.
View our latest analysis for Advance Synergy Berhad
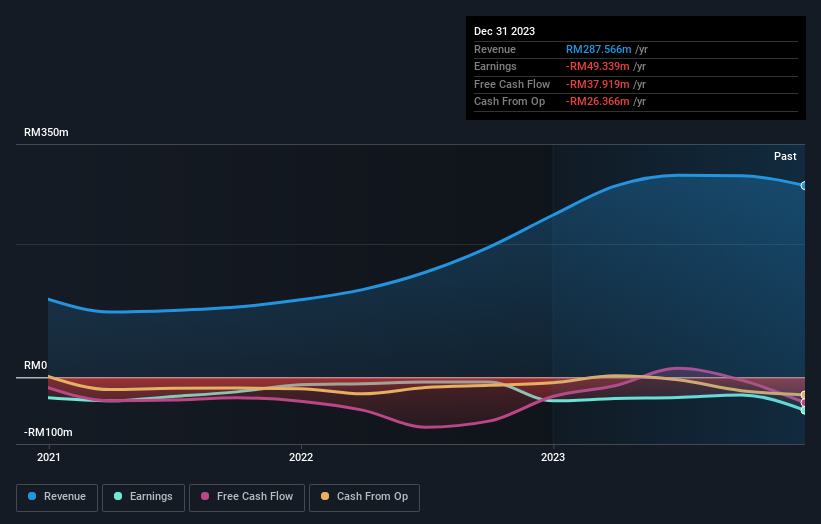
Given that Advance Synergy Berhad didn't make a profit in the last twelve months, we'll focus on revenue growth to form a quick view of its business development. Generally speaking, companies without profits are expected to grow revenue every year, and at a good clip. That's because it's hard to be confident a company will be sustainable if revenue growth is negligible, and it never makes a profit.
Over half a decade Advance Synergy Berhad reduced its trailing twelve month revenue by 0.9% for each year. While far from catastrophic that is not good. The stock hasn't done well for shareholders in the last five years, falling 4%, annualized. But it doesn't surprise given the falling revenue. Without profits, its hard to see how shareholders win if the revenue keeps falling.
You can see how earnings and revenue have changed over time in the image below (click on the chart to see the exact values).
Take a more thorough look at Advance Synergy Berhad's financial health with this free report on its balance sheet.
What About Dividends?
It is important to consider the total shareholder return, as well as the share price return, for any given stock. Whereas the share price return only reflects the change in the share price, the TSR includes the value of dividends (assuming they were reinvested) and the benefit of any discounted capital raising or spin-off. Arguably, the TSR gives a more comprehensive picture of the return generated by a stock. We note that for Advance Synergy Berhad the TSR over the last 5 years was 1.9%, which is better than the share price return mentioned above. The dividends paid by the company have thusly boosted the total shareholder return.
A Different Perspective
Investors in Advance Synergy Berhad had a tough year, with a total loss of 3.4% (including dividends), against a market gain of about 23%. However, keep in mind that even the best stocks will sometimes underperform the market over a twelve month period. On the bright side, long term shareholders have made money, with a gain of 0.4% per year over half a decade. It could be that the recent sell-off is an opportunity, so it may be worth checking the fundamental data for signs of a long term growth trend. I find it very interesting to look at share price over the long term as a proxy for business performance. But to truly gain insight, we need to consider other information, too. Even so, be aware that Advance Synergy Berhad is showing 3 warning signs in our investment analysis , and 2 of those are potentially serious...
We will like Advance Synergy Berhad better if we see some big insider buys. While we wait, check out this free list of undervalued stocks (mostly small caps) with considerable, recent, insider buying.
Please note, the market returns quoted in this article reflect the market weighted average returns of stocks that currently trade on Malaysian exchanges.
Valuation is complex, but we're helping make it simple.
Find out whether Advance Synergy Berhad is potentially over or undervalued by checking out our comprehensive analysis, which includes fair value estimates, risks and warnings, dividends, insider transactions and financial health.
View the Free AnalysisHave feedback on this article? Concerned about the content? Get in touch with us directly. Alternatively, email editorial-team (at) simplywallst.com.
This article by Simply Wall St is general in nature. We provide commentary based on historical data and analyst forecasts only using an unbiased methodology and our articles are not intended to be financial advice. It does not constitute a recommendation to buy or sell any stock, and does not take account of your objectives, or your financial situation. We aim to bring you long-term focused analysis driven by fundamental data. Note that our analysis may not factor in the latest price-sensitive company announcements or qualitative material. Simply Wall St has no position in any stocks mentioned.
About KLSE:ASB
Advance Synergy Berhad
An investment holding company, operates in the property development and investment services in Malaysia, Singapore, Africa and Middle East, Europe, and internationally.
Excellent balance sheet and overvalued.

