- Mexico
- /
- Metals and Mining
- /
- BMV:PE&OLES *
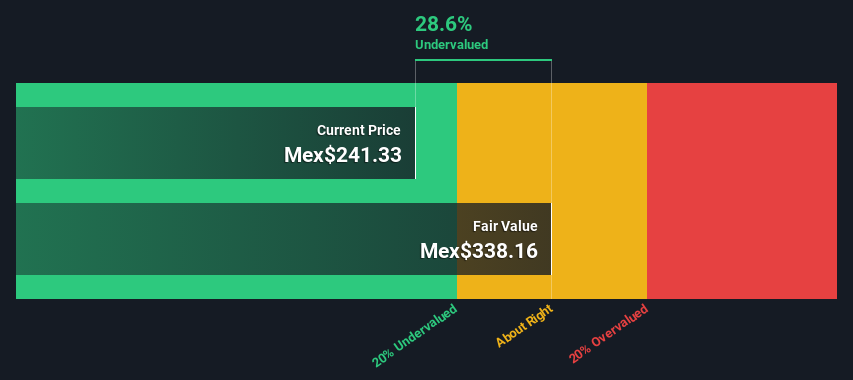
Is There An Opportunity With Industrias Peñoles, S.A.B. de C.V.'s (BMV:PE&OLES) 29% Undervaluation?


Key Insights
- The projected fair value for Industrias Peñoles. de is Mex$338 based on 2 Stage Free Cash Flow to Equity
- Current share price of Mex$241 suggests Industrias Peñoles. de is potentially 29% undervalued
- Analyst price target for PE&OLES * is US$257 which is 24% below our fair value estimate
Today we'll do a simple run through of a valuation method used to estimate the attractiveness of Industrias Peñoles, S.A.B. de C.V. (BMV:PE&OLES) as an investment opportunity by taking the expected future cash flows and discounting them to their present value. The Discounted Cash Flow (DCF) model is the tool we will apply to do this. Believe it or not, it's not too difficult to follow, as you'll see from our example!
Remember though, that there are many ways to estimate a company's value, and a DCF is just one method. For those who are keen learners of equity analysis, the Simply Wall St analysis model here may be something of interest to you.
See our latest analysis for Industrias Peñoles. de
The Model
We are going to use a two-stage DCF model, which, as the name states, takes into account two stages of growth. The first stage is generally a higher growth period which levels off heading towards the terminal value, captured in the second 'steady growth' period. In the first stage we need to estimate the cash flows to the business over the next ten years. Where possible we use analyst estimates, but when these aren't available we extrapolate the previous free cash flow (FCF) from the last estimate or reported value. We assume companies with shrinking free cash flow will slow their rate of shrinkage, and that companies with growing free cash flow will see their growth rate slow, over this period. We do this to reflect that growth tends to slow more in the early years than it does in later years.
A DCF is all about the idea that a dollar in the future is less valuable than a dollar today, so we discount the value of these future cash flows to their estimated value in today's dollars:
10-year free cash flow (FCF) forecast
| 2024 | 2025 | 2026 | 2027 | 2028 | 2029 | 2030 | 2031 | 2032 | 2033 | |
| Levered FCF ($, Millions) | US$281.9m | US$562.7m | US$816.6m | US$1.09b | US$1.38b | US$1.66b | US$1.93b | US$2.20b | US$2.46b | US$2.73b |
| Growth Rate Estimate Source | Analyst x1 | Analyst x1 | Est @ 45.12% | Est @ 33.85% | Est @ 25.96% | Est @ 20.44% | Est @ 16.57% | Est @ 13.86% | Est @ 11.97% | Est @ 10.64% |
| Present Value ($, Millions) Discounted @ 21% | US$234 | US$387 | US$466 | US$517 | US$540 | US$539 | US$521 | US$492 | US$457 | US$419 |
("Est" = FCF growth rate estimated by Simply Wall St)
Present Value of 10-year Cash Flow (PVCF) = US$4.6b
After calculating the present value of future cash flows in the initial 10-year period, we need to calculate the Terminal Value, which accounts for all future cash flows beyond the first stage. The Gordon Growth formula is used to calculate Terminal Value at a future annual growth rate equal to the 5-year average of the 10-year government bond yield of 7.6%. We discount the terminal cash flows to today's value at a cost of equity of 21%.
Terminal Value (TV)= FCF2033 × (1 + g) ÷ (r – g) = US$2.7b× (1 + 7.6%) ÷ (21%– 7.6%) = US$22b
Present Value of Terminal Value (PVTV)= TV / (1 + r)10= US$22b÷ ( 1 + 21%)10= US$3.5b
The total value is the sum of cash flows for the next ten years plus the discounted terminal value, which results in the Total Equity Value, which in this case is US$8.0b. The last step is to then divide the equity value by the number of shares outstanding. Compared to the current share price of Mex$241, the company appears a touch undervalued at a 29% discount to where the stock price trades currently. Remember though, that this is just an approximate valuation, and like any complex formula - garbage in, garbage out.
Important Assumptions
Now the most important inputs to a discounted cash flow are the discount rate, and of course, the actual cash flows. Part of investing is coming up with your own evaluation of a company's future performance, so try the calculation yourself and check your own assumptions. The DCF also does not consider the possible cyclicality of an industry, or a company's future capital requirements, so it does not give a full picture of a company's potential performance. Given that we are looking at Industrias Peñoles. de as potential shareholders, the cost of equity is used as the discount rate, rather than the cost of capital (or weighted average cost of capital, WACC) which accounts for debt. In this calculation we've used 21%, which is based on a levered beta of 1.413. Beta is a measure of a stock's volatility, compared to the market as a whole. We get our beta from the industry average beta of globally comparable companies, with an imposed limit between 0.8 and 2.0, which is a reasonable range for a stable business.
SWOT Analysis for Industrias Peñoles. de
- Net debt to equity ratio below 40%.
- Earnings declined over the past year.
- Interest payments on debt are not well covered.
- Annual earnings are forecast to grow faster than the Mexican market.
- Trading below our estimate of fair value by more than 20%.
- Debt is not well covered by operating cash flow.
- Annual revenue is forecast to grow slower than the Mexican market.
Next Steps:
Valuation is only one side of the coin in terms of building your investment thesis, and it ideally won't be the sole piece of analysis you scrutinize for a company. The DCF model is not a perfect stock valuation tool. Rather it should be seen as a guide to "what assumptions need to be true for this stock to be under/overvalued?" For instance, if the terminal value growth rate is adjusted slightly, it can dramatically alter the overall result. What is the reason for the share price sitting below the intrinsic value? For Industrias Peñoles. de, there are three pertinent elements you should further research:
- Risks: As an example, we've found 3 warning signs for Industrias Peñoles. de that you need to consider before investing here.
- Future Earnings: How does PE&OLES *'s growth rate compare to its peers and the wider market? Dig deeper into the analyst consensus number for the upcoming years by interacting with our free analyst growth expectation chart.
- Other High Quality Alternatives: Do you like a good all-rounder? Explore our interactive list of high quality stocks to get an idea of what else is out there you may be missing!
PS. Simply Wall St updates its DCF calculation for every Mexican stock every day, so if you want to find the intrinsic value of any other stock just search here.
New: AI Stock Screener & Alerts
Our new AI Stock Screener scans the market every day to uncover opportunities.
• Dividend Powerhouses (3%+ Yield)
• Undervalued Small Caps with Insider Buying
• High growth Tech and AI Companies
Or build your own from over 50 metrics.
Have feedback on this article? Concerned about the content? Get in touch with us directly. Alternatively, email editorial-team (at) simplywallst.com.
This article by Simply Wall St is general in nature. We provide commentary based on historical data and analyst forecasts only using an unbiased methodology and our articles are not intended to be financial advice. It does not constitute a recommendation to buy or sell any stock, and does not take account of your objectives, or your financial situation. We aim to bring you long-term focused analysis driven by fundamental data. Note that our analysis may not factor in the latest price-sensitive company announcements or qualitative material. Simply Wall St has no position in any stocks mentioned.
About BMV:PE&OLES *
Industrias Peñoles. de
Engages in the exploration, extraction, and sale of mineral concentrates and ores in Mexico, Europe, Asia, North America, South America, and internationally.
Excellent balance sheet with questionable track record.

