
Advertisement
- Luxembourg
- /
- Media
- /
- BDL:SESGL
Further weakness as SES (BDL:SESGL) drops 4.1% this week, taking five-year losses to 54%
Generally speaking long term investing is the way to go. But no-one is immune from buying too high. Zooming in on an example, the SES S.A. (BDL:SESGL) share price dropped 65% in the last half decade. That is extremely sub-optimal, to say the least. The falls have accelerated recently, with the share price down 24% in the last three months.
With the stock having lost 4.1% in the past week, it's worth taking a look at business performance and seeing if there's any red flags.
See our latest analysis for SES
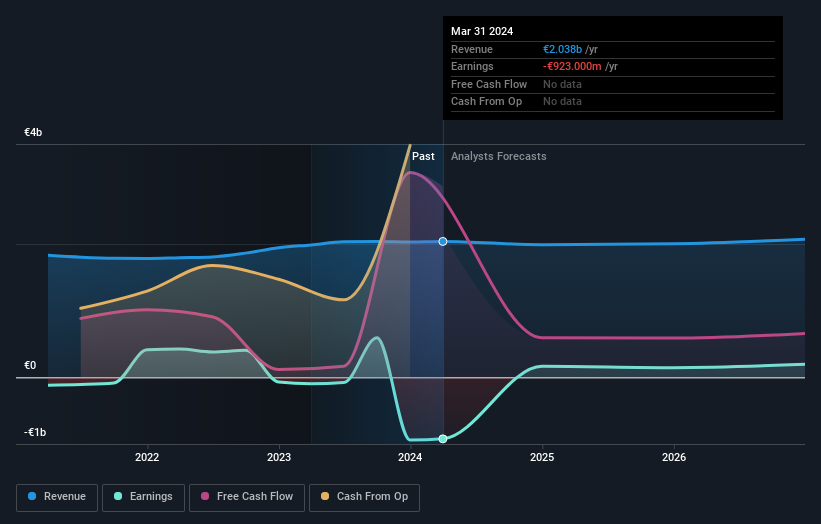
SES wasn't profitable in the last twelve months, it is unlikely we'll see a strong correlation between its share price and its earnings per share (EPS). Arguably revenue is our next best option. Shareholders of unprofitable companies usually desire strong revenue growth. As you can imagine, fast revenue growth, when maintained, often leads to fast profit growth.
In the last half decade, SES saw its revenue increase by 0.2% per year. That's not a very high growth rate considering it doesn't make profits. It's likely this weak growth has contributed to an annualised return of 11% for the last five years. We want to see an acceleration of revenue growth (or profits) before showing much interest in this one. When a stock falls hard like this, some investors like to add the company to a watchlist (in case the business recovers, longer term).
You can see below how earnings and revenue have changed over time (discover the exact values by clicking on the image).
Balance sheet strength is crucial. It might be well worthwhile taking a look at our free report on how its financial position has changed over time.
What About Dividends?
As well as measuring the share price return, investors should also consider the total shareholder return (TSR). Whereas the share price return only reflects the change in the share price, the TSR includes the value of dividends (assuming they were reinvested) and the benefit of any discounted capital raising or spin-off. So for companies that pay a generous dividend, the TSR is often a lot higher than the share price return. As it happens, SES' TSR for the last 5 years was -54%, which exceeds the share price return mentioned earlier. The dividends paid by the company have thusly boosted the total shareholder return.
A Different Perspective
Investors in SES had a tough year, with a total loss of 8.5% (including dividends), against a market gain of about 11%. However, keep in mind that even the best stocks will sometimes underperform the market over a twelve month period. However, the loss over the last year isn't as bad as the 9% per annum loss investors have suffered over the last half decade. We would want clear information suggesting the company will grow, before taking the view that the share price will stabilize. I find it very interesting to look at share price over the long term as a proxy for business performance. But to truly gain insight, we need to consider other information, too. Even so, be aware that SES is showing 1 warning sign in our investment analysis , you should know about...
Of course, you might find a fantastic investment by looking elsewhere. So take a peek at this free list of companies we expect will grow earnings.
Please note, the market returns quoted in this article reflect the market weighted average returns of stocks that currently trade on Luxembourger exchanges.
New: Manage All Your Stock Portfolios in One Place
We've created the ultimate portfolio companion for stock investors, and it's free.
• Connect an unlimited number of Portfolios and see your total in one currency
• Be alerted to new Warning Signs or Risks via email or mobile
• Track the Fair Value of your stocks
Have feedback on this article? Concerned about the content? Get in touch with us directly. Alternatively, email editorial-team (at) simplywallst.com.
This article by Simply Wall St is general in nature. We provide commentary based on historical data and analyst forecasts only using an unbiased methodology and our articles are not intended to be financial advice. It does not constitute a recommendation to buy or sell any stock, and does not take account of your objectives, or your financial situation. We aim to bring you long-term focused analysis driven by fundamental data. Note that our analysis may not factor in the latest price-sensitive company announcements or qualitative material. Simply Wall St has no position in any stocks mentioned.
Have feedback on this article? Concerned about the content? Get in touch with us directly. Alternatively, email editorial-team@simplywallst.com
About BDL:SESGL
SES
Provides satellite-based data transmission capacity and ancillary services worldwide.
Reasonable growth potential with adequate balance sheet.
Similar Companies
Market Insights

Advertisement
Community Narratives
The company that turned a verb into a global necessity and basically runs the modern internet, digital ads, smartphones, maps, and AI.
Fair Value US$300.00|7.5% undervalued
OS
Community Contributor
Flowers Foods Pays A Fair Price For Health
Fair Value US$16.12|25.4% undervalued
NV
Community Contributor
TMX Group will thrive with 33.3% profit margin and enduring market moat
Fair Value CA$49.90|3.6% overvalued
LI
Community Contributor
The "Molecular Pencil": Why Beam's Technology is Built to Win
Fair Value US$65.01|65.0% undervalued
DA
Community Contributor