
A017390 Stock Overview
Supplies natural gas in South Korea. More details
| Snowflake Score | |
|---|---|
| Valuation | 4/6 |
| Future Growth | 0/6 |
| Past Performance | 3/6 |
| Financial Health | 5/6 |
| Dividends | 4/6 |
Community vs My Fair Value
Create NarrativeSelect a narrative for quick price alerts from the community, or create your own.
Seoul City Gas Co., Ltd. Competitors
Price History & Performance
| Historical stock prices | |
|---|---|
| Current Share Price | ₩60,100.00 |
| 52 Week High | ₩60,500.00 |
| 52 Week Low | ₩47,500.00 |
| Beta | 0.29 |
| 1 Month Change | 18.07% |
| 3 Month Change | 22.03% |
| 1 Year Change | 7.13% |
| 3 Year Change | -71.65% |
| 5 Year Change | -15.83% |
| Change since IPO | 30.84% |
Recent News & Updates
Recent updates
Solid Earnings May Not Tell The Whole Story For Seoul City Gas (KRX:017390)
Nov 23Seoul City Gas' (KRX:017390) Solid Earnings May Rest On Weak Foundations
Mar 20Here's What You Should Know About Seoul City Gas Co., Ltd.'s (KRX:017390) 1.7% Dividend Yield
Apr 30Is Seoul City Gas (KRX:017390) A Risky Investment?
Mar 31Do Seoul City Gas's (KRX:017390) Earnings Warrant Your Attention?
Mar 04Did You Participate In Any Of Seoul City Gas' (KRX:017390) Respectable 71% Return?
Feb 14Estimating The Intrinsic Value Of Seoul City Gas Co., Ltd. (KRX:017390)
Jan 30Is It Worth Buying Seoul City Gas Co., Ltd. (KRX:017390) For Its 1.9% Dividend Yield?
Jan 15These 4 Measures Indicate That Seoul City Gas (KRX:017390) Is Using Debt Safely
Dec 31Should You Rely On Seoul City Gas's (KRX:017390) Earnings Growth?
Dec 16Here's Why I Think Seoul City Gas (KRX:017390) Is An Interesting Stock
Dec 01Shareholder Returns
| A017390 | KR Gas Utilities | KR Market | |
|---|---|---|---|
| 7D | 7.5% | 6.3% | 3.9% |
| 1Y | 7.1% | 29.8% | -1.3% |
Return vs Industry: A017390 underperformed the KR Gas Utilities industry which returned 29.8% over the past year.
Return vs Market: A017390 exceeded the KR Market which returned -1.3% over the past year.
Price Volatility
| A017390 volatility | |
|---|---|
| A017390 Average Weekly Movement | 2.2% |
| Gas Utilities Industry Average Movement | 2.7% |
| Market Average Movement | 6.2% |
| 10% most volatile stocks in KR Market | 12.4% |
| 10% least volatile stocks in KR Market | 3.0% |
Stable Share Price: A017390 has not had significant price volatility in the past 3 months compared to the KR market.
Volatility Over Time: A017390's weekly volatility (2%) has been stable over the past year.
About the Company
| Founded | Employees | CEO | Website |
|---|---|---|---|
| 1983 | 504 | Seung-Bae Yoo | www.seoulgas.co.kr |
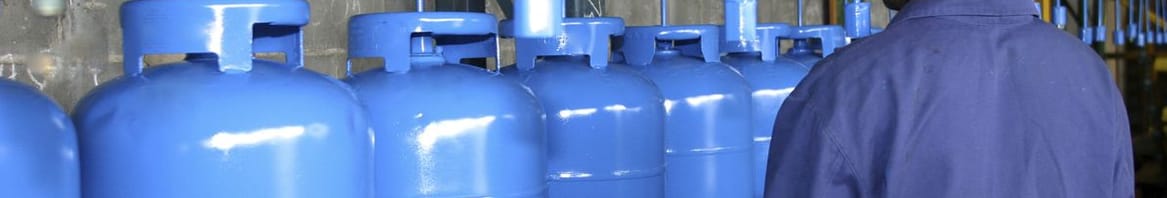
Seoul City Gas Co., Ltd. supplies natural gas in South Korea. It also engages in construction activities; real estate rental business; crude oil and natural gas mining business; tourism accommodation facility operation; and management of city gas agency. The company was founded in 1983 and is headquartered in Seoul, South Korea.
Seoul City Gas Co., Ltd. Fundamentals Summary
| A017390 fundamental statistics | |
|---|---|
| Market cap | ₩236.36b |
| Earnings (TTM) | ₩31.80b |
| Revenue (TTM) | ₩1.77t |
Is A017390 overvalued?
See Fair Value and valuation analysisEarnings & Revenue
| A017390 income statement (TTM) | |
|---|---|
| Revenue | ₩1.77t |
| Cost of Revenue | ₩1.57t |
| Gross Profit | ₩196.97b |
| Other Expenses | ₩165.17b |
| Earnings | ₩31.80b |
Last Reported Earnings
Mar 31, 2025
Next Earnings Date
n/a
| Earnings per share (EPS) | 8.09k |
| Gross Margin | 11.13% |
| Net Profit Margin | 1.80% |
| Debt/Equity Ratio | 0.6% |
How did A017390 perform over the long term?
See historical performance and comparisonDividends
Company Analysis and Financial Data Status
| Data | Last Updated (UTC time) |
|---|---|
| Company Analysis | 2025/05/31 20:49 |
| End of Day Share Price | 2025/05/30 00:00 |
| Earnings | 2025/03/31 |
| Annual Earnings | 2024/12/31 |
Data Sources
The data used in our company analysis is from S&P Global Market Intelligence LLC. The following data is used in our analysis model to generate this report. Data is normalised which can introduce a delay from the source being available.
| Package | Data | Timeframe | Example US Source * |
|---|---|---|---|
| Company Financials | 10 years |
| |
| Analyst Consensus Estimates | +3 years |
|
|
| Market Prices | 30 years |
| |
| Ownership | 10 years |
| |
| Management | 10 years |
| |
| Key Developments | 10 years |
|
* Example for US securities, for non-US equivalent regulatory forms and sources are used.
Unless specified all financial data is based on a yearly period but updated quarterly. This is known as Trailing Twelve Month (TTM) or Last Twelve Month (LTM) Data. Learn more.
Analysis Model and Snowflake
Details of the analysis model used to generate this report is available on our Github page, we also have guides on how to use our reports and tutorials on Youtube.
Learn about the world class team who designed and built the Simply Wall St analysis model.
Industry and Sector Metrics
Our industry and section metrics are calculated every 6 hours by Simply Wall St, details of our process are available on Github.
Analyst Sources
Seoul City Gas Co., Ltd. is covered by 4 analysts. 0 of those analysts submitted the estimates of revenue or earnings used as inputs to our report. Analysts submissions are updated throughout the day.
| Analyst | Institution |
|---|---|
| Heonseok Jee | KB Securities Co., Ltd. |
| Chang Mok Lee | NH Investment & Securities Co., Ltd. |
| Seung Shik Kim | Samsung Securities Co. Ltd. |