
Advertisement
- South Korea
- /
- Gas Utilities
- /
- KOSE:A004690
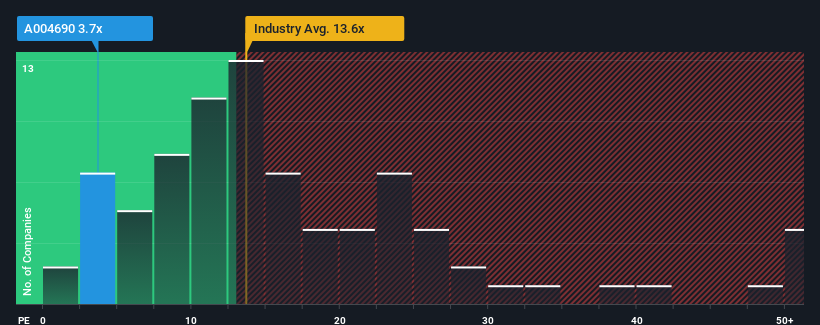
Investors Still Aren't Entirely Convinced By Samchully Co.,Ltd's (KRX:004690) Earnings Despite 31% Price Jump
Samchully Co.,Ltd (KRX:004690) shareholders have had their patience rewarded with a 31% share price jump in the last month. The last 30 days bring the annual gain to a very sharp 30%.
In spite of the firm bounce in price, given about half the companies in Korea have price-to-earnings ratios (or "P/E's") above 12x, you may still consider SamchullyLtd as a highly attractive investment with its 3.7x P/E ratio. However, the P/E might be quite low for a reason and it requires further investigation to determine if it's justified.
Our free stock report includes 1 warning sign investors should be aware of before investing in SamchullyLtd. Read for free now.As an illustration, earnings have deteriorated at SamchullyLtd over the last year, which is not ideal at all. It might be that many expect the disappointing earnings performance to continue or accelerate, which has repressed the P/E. If you like the company, you'd be hoping this isn't the case so that you could potentially pick up some stock while it's out of favour.
Check out our latest analysis for SamchullyLtd
Is There Any Growth For SamchullyLtd?
SamchullyLtd's P/E ratio would be typical for a company that's expected to deliver very poor growth or even falling earnings, and importantly, perform much worse than the market.
If we review the last year of earnings, dishearteningly the company's profits fell to the tune of 3.0%. Even so, admirably EPS has lifted 93% in aggregate from three years ago, notwithstanding the last 12 months. Although it's been a bumpy ride, it's still fair to say the earnings growth recently has been more than adequate for the company.
Weighing that recent medium-term earnings trajectory against the broader market's one-year forecast for expansion of 21% shows it's noticeably more attractive on an annualised basis.
In light of this, it's peculiar that SamchullyLtd's P/E sits below the majority of other companies. Apparently some shareholders believe the recent performance has exceeded its limits and have been accepting significantly lower selling prices.
The Bottom Line On SamchullyLtd's P/E
Shares in SamchullyLtd are going to need a lot more upward momentum to get the company's P/E out of its slump. Generally, our preference is to limit the use of the price-to-earnings ratio to establishing what the market thinks about the overall health of a company.
Our examination of SamchullyLtd revealed its three-year earnings trends aren't contributing to its P/E anywhere near as much as we would have predicted, given they look better than current market expectations. There could be some major unobserved threats to earnings preventing the P/E ratio from matching this positive performance. It appears many are indeed anticipating earnings instability, because the persistence of these recent medium-term conditions would normally provide a boost to the share price.
You always need to take note of risks, for example - SamchullyLtd has 1 warning sign we think you should be aware of.
If you're unsure about the strength of SamchullyLtd's business, why not explore our interactive list of stocks with solid business fundamentals for some other companies you may have missed.
New: Manage All Your Stock Portfolios in One Place
We've created the ultimate portfolio companion for stock investors, and it's free.
• Connect an unlimited number of Portfolios and see your total in one currency
• Be alerted to new Warning Signs or Risks via email or mobile
• Track the Fair Value of your stocks
Have feedback on this article? Concerned about the content? Get in touch with us directly. Alternatively, email editorial-team (at) simplywallst.com.
This article by Simply Wall St is general in nature. We provide commentary based on historical data and analyst forecasts only using an unbiased methodology and our articles are not intended to be financial advice. It does not constitute a recommendation to buy or sell any stock, and does not take account of your objectives, or your financial situation. We aim to bring you long-term focused analysis driven by fundamental data. Note that our analysis may not factor in the latest price-sensitive company announcements or qualitative material. Simply Wall St has no position in any stocks mentioned.
About KOSE:A004690
SamchullyLtd
Engages in the supplying of natural gas in South Korea and the United States.
Flawless balance sheet established dividend payer.
Market Insights

Advertisement
Community Narratives
MicroVision will explode future revenue by 380.37% with a vision towards success
Fair Value US$60.00|98.4% undervalued
TH
Community Contributor
The Indispensable Artery for a New North American Economy
Fair Value CA$132.87|1.3% undervalued
TI
Community Contributor