
Advertisement
- South Korea
- /
- Telecom Services and Carriers
- /
- KOSDAQ:A036630
Sejong Telecom, Inc.'s (KOSDAQ:036630) P/S Is Still On The Mark Following 81% Share Price Bounce
Sejong Telecom, Inc. (KOSDAQ:036630) shares have had a really impressive month, gaining 81% after a shaky period beforehand. Unfortunately, despite the strong performance over the last month, the full year gain of 3.2% isn't as attractive.
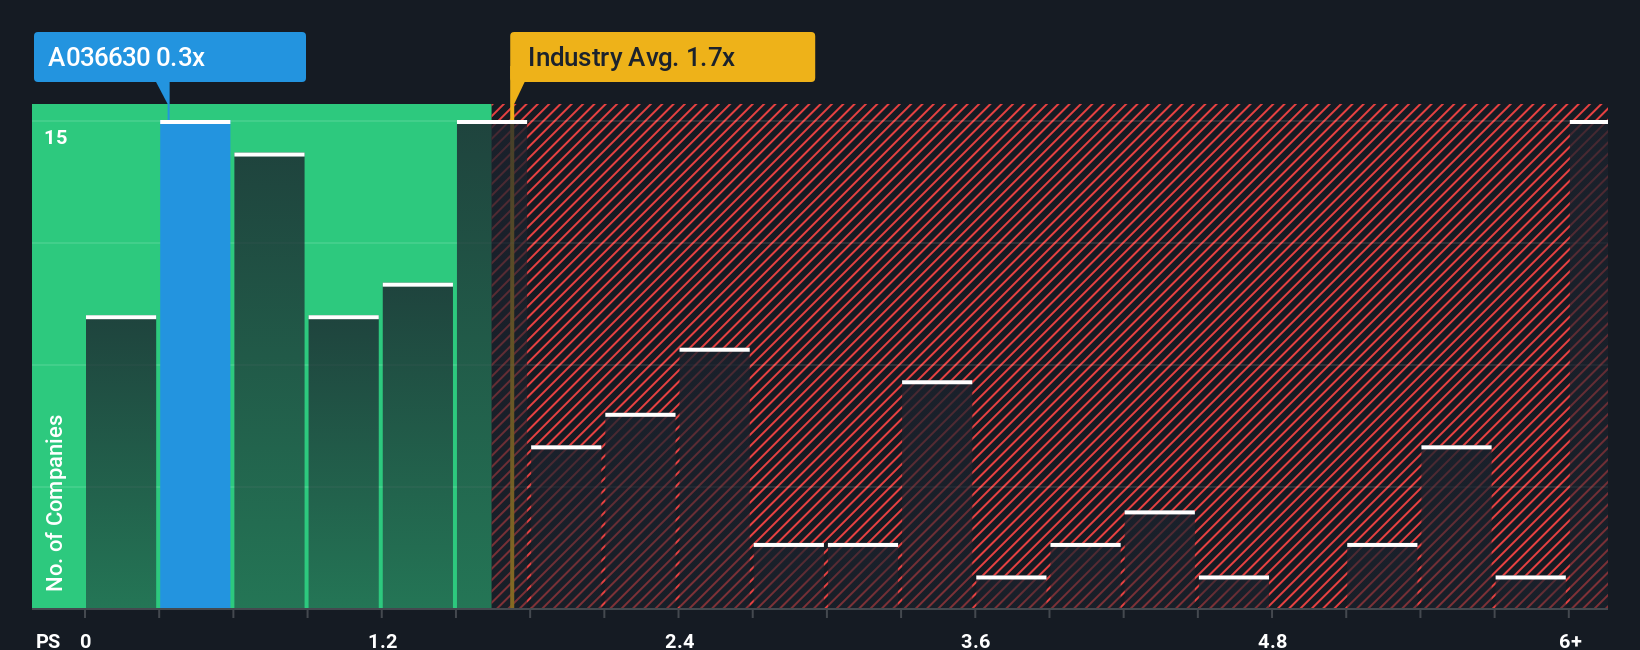
Although its price has surged higher, it's still not a stretch to say that Sejong Telecom's price-to-sales (or "P/S") ratio of 0.3x right now seems quite "middle-of-the-road" compared to the Telecom industry in Korea, where the median P/S ratio is around 0.4x. While this might not raise any eyebrows, if the P/S ratio is not justified investors could be missing out on a potential opportunity or ignoring looming disappointment.
See our latest analysis for Sejong Telecom
What Does Sejong Telecom's P/S Mean For Shareholders?
We'd have to say that with no tangible growth over the last year, Sejong Telecom's revenue has been unimpressive. Perhaps the market believes the recent run-of-the-mill revenue performance isn't enough to outperform the industry, which has kept the P/S muted. If not, then existing shareholders may be feeling hopeful about the future direction of the share price.
Although there are no analyst estimates available for Sejong Telecom, take a look at this free data-rich visualisation to see how the company stacks up on earnings, revenue and cash flow.Do Revenue Forecasts Match The P/S Ratio?
The only time you'd be comfortable seeing a P/S like Sejong Telecom's is when the company's growth is tracking the industry closely.
Taking a look back first, we see that there was hardly any revenue growth to speak of for the company over the past year. Fortunately, a few good years before that means that it was still able to grow revenue by 14% in total over the last three years. Therefore, it's fair to say that revenue growth has been inconsistent recently for the company.
Comparing that to the industry, which is predicted to deliver 4.7% growth in the next 12 months, the company's momentum is pretty similar based on recent medium-term annualised revenue results.
In light of this, it's understandable that Sejong Telecom's P/S sits in line with the majority of other companies. It seems most investors are expecting to see average growth rates continue into the future and are only willing to pay a moderate amount for the stock.
What Does Sejong Telecom's P/S Mean For Investors?
Sejong Telecom appears to be back in favour with a solid price jump bringing its P/S back in line with other companies in the industry We'd say the price-to-sales ratio's power isn't primarily as a valuation instrument but rather to gauge current investor sentiment and future expectations.
It appears to us that Sejong Telecom maintains its moderate P/S off the back of its recent three-year growth being in line with the wider industry forecast. With previous revenue trends that keep up with the current industry outlook, it's hard to justify the company's P/S ratio deviating much from it's current point. If recent medium-term revenue trends continue, it's hard to see the share price moving strongly in either direction in the near future under these circumstances.
We don't want to rain on the parade too much, but we did also find 3 warning signs for Sejong Telecom (2 are concerning!) that you need to be mindful of.
Of course, profitable companies with a history of great earnings growth are generally safer bets. So you may wish to see this free collection of other companies that have reasonable P/E ratios and have grown earnings strongly.
New: Manage All Your Stock Portfolios in One Place
We've created the ultimate portfolio companion for stock investors, and it's free.
• Connect an unlimited number of Portfolios and see your total in one currency
• Be alerted to new Warning Signs or Risks via email or mobile
• Track the Fair Value of your stocks
Have feedback on this article? Concerned about the content? Get in touch with us directly. Alternatively, email editorial-team (at) simplywallst.com.
This article by Simply Wall St is general in nature. We provide commentary based on historical data and analyst forecasts only using an unbiased methodology and our articles are not intended to be financial advice. It does not constitute a recommendation to buy or sell any stock, and does not take account of your objectives, or your financial situation. We aim to bring you long-term focused analysis driven by fundamental data. Note that our analysis may not factor in the latest price-sensitive company announcements or qualitative material. Simply Wall St has no position in any stocks mentioned.
About KOSDAQ:A036630
Sejong Telecom
Operates as a telecommunications carrier in South Korea and internationally.
Mediocre balance sheet with low risk.
Similar Companies
Market Insights

Advertisement
Community Narratives
MicroVision will explode future revenue by 380.37% with a vision towards success
Fair Value US$60.00|98.4% undervalued
TH
Community Contributor
The Indispensable Artery for a New North American Economy
Fair Value CA$132.87|1.3% undervalued
TI
Community Contributor