
Advertisement
- South Korea
- /
- Electronic Equipment and Components
- /
- KOSE:A248070
Does Solum (KRX:248070) Have A Healthy Balance Sheet?
Some say volatility, rather than debt, is the best way to think about risk as an investor, but Warren Buffett famously said that 'Volatility is far from synonymous with risk.' So it seems the smart money knows that debt - which is usually involved in bankruptcies - is a very important factor, when you assess how risky a company is. We can see that Solum Co., Ltd. (KRX:248070) does use debt in its business. But the more important question is: how much risk is that debt creating?
When Is Debt Dangerous?
Debt assists a business until the business has trouble paying it off, either with new capital or with free cash flow. If things get really bad, the lenders can take control of the business. While that is not too common, we often do see indebted companies permanently diluting shareholders because lenders force them to raise capital at a distressed price. By replacing dilution, though, debt can be an extremely good tool for businesses that need capital to invest in growth at high rates of return. When we examine debt levels, we first consider both cash and debt levels, together.
Check out our latest analysis for Solum
What Is Solum's Net Debt?
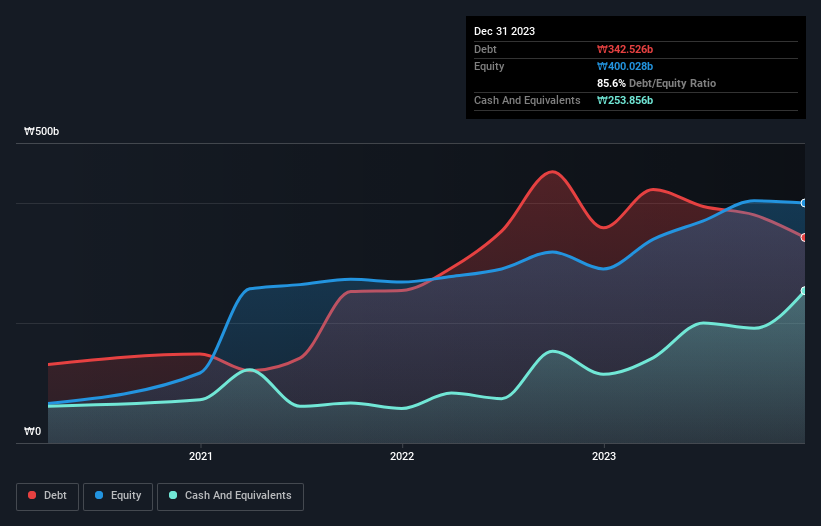
You can click the graphic below for the historical numbers, but it shows that Solum had ₩342.5b of debt in December 2023, down from ₩358.7b, one year before. However, it does have ₩253.9b in cash offsetting this, leading to net debt of about ₩88.7b.
How Healthy Is Solum's Balance Sheet?
We can see from the most recent balance sheet that Solum had liabilities of ₩505.1b falling due within a year, and liabilities of ₩33.5b due beyond that. Offsetting this, it had ₩253.9b in cash and ₩125.8b in receivables that were due within 12 months. So its liabilities total ₩158.9b more than the combination of its cash and short-term receivables.
Of course, Solum has a market capitalization of ₩1.31t, so these liabilities are probably manageable. But there are sufficient liabilities that we would certainly recommend shareholders continue to monitor the balance sheet, going forward.
In order to size up a company's debt relative to its earnings, we calculate its net debt divided by its earnings before interest, tax, depreciation, and amortization (EBITDA) and its earnings before interest and tax (EBIT) divided by its interest expense (its interest cover). This way, we consider both the absolute quantum of the debt, as well as the interest rates paid on it.
With net debt sitting at just 0.46 times EBITDA, Solum is arguably pretty conservatively geared. And this view is supported by the solid interest coverage, with EBIT coming in at 8.3 times the interest expense over the last year. Better yet, Solum grew its EBIT by 104% last year, which is an impressive improvement. That boost will make it even easier to pay down debt going forward. There's no doubt that we learn most about debt from the balance sheet. But ultimately the future profitability of the business will decide if Solum can strengthen its balance sheet over time. So if you're focused on the future you can check out this free report showing analyst profit forecasts.
But our final consideration is also important, because a company cannot pay debt with paper profits; it needs cold hard cash. So the logical step is to look at the proportion of that EBIT that is matched by actual free cash flow. Over the last three years, Solum recorded negative free cash flow, in total. Debt is usually more expensive, and almost always more risky in the hands of a company with negative free cash flow. Shareholders ought to hope for an improvement.
Our View
Happily, Solum's impressive EBIT growth rate implies it has the upper hand on its debt. But we must concede we find its conversion of EBIT to free cash flow has the opposite effect. Looking at all the aforementioned factors together, it strikes us that Solum can handle its debt fairly comfortably. On the plus side, this leverage can boost shareholder returns, but the potential downside is more risk of loss, so it's worth monitoring the balance sheet. Over time, share prices tend to follow earnings per share, so if you're interested in Solum, you may well want to click here to check an interactive graph of its earnings per share history.
At the end of the day, it's often better to focus on companies that are free from net debt. You can access our special list of such companies (all with a track record of profit growth). It's free.
New: Manage All Your Stock Portfolios in One Place
We've created the ultimate portfolio companion for stock investors, and it's free.
• Connect an unlimited number of Portfolios and see your total in one currency
• Be alerted to new Warning Signs or Risks via email or mobile
• Track the Fair Value of your stocks
Have feedback on this article? Concerned about the content? Get in touch with us directly. Alternatively, email editorial-team (at) simplywallst.com.
This article by Simply Wall St is general in nature. We provide commentary based on historical data and analyst forecasts only using an unbiased methodology and our articles are not intended to be financial advice. It does not constitute a recommendation to buy or sell any stock, and does not take account of your objectives, or your financial situation. We aim to bring you long-term focused analysis driven by fundamental data. Note that our analysis may not factor in the latest price-sensitive company announcements or qualitative material. Simply Wall St has no position in any stocks mentioned.
About KOSE:A248070
Solum
Manufactures and markets power modules, digital tuners, and electronic shelf labels to customers in South Korea and internationally.
Adequate balance sheet with moderate growth potential.
Similar Companies
Market Insights

Advertisement
Community Narratives
MicroVision will explode future revenue by 380.37% with a vision towards success
Fair Value US$60|98.4% undervalued
TH
Community Contributor
The Indispensable Artery for a New North American Economy
Fair Value CA$132.87|1.6% undervalued
TI
Community Contributor
Recently Updated Narratives
BE


Bejgal on MINISO Group Holding ·
MINISO's fair value is projected at 26.69 with an anticipated PE ratio shift of 20x
Fair Value:US$26.6928.0% undervalued
44 followersusers have followed this narrative
3 commentsusers have commented on this narrative
0 likesusers have liked this narrative
TI


TickerTickle on Oracle ·
The Quiet Giant That Became AI’s Power Grid
Fair Value:US$389.8149.5% undervalued
7 followersusers have followed this narrative
1 commentusers have commented on this narrative
0 likesusers have liked this narrative
AU

AuCA on Nova Ljubljanska Banka d.d ·
Nova Ljubljanska Banka d.d will expect a 11.2% revenue boost driving future growth
Fair Value:€20916.3% undervalued
23 followersusers have followed this narrative
3 commentsusers have commented on this narrative
0 likesusers have liked this narrative
Popular Narratives
OS


oscargarcia on Alphabet ·
The company that turned a verb into a global necessity and basically runs the modern internet, digital ads, smartphones, maps, and AI.
Fair Value:US$3404.9% undervalued
135 followersusers have followed this narrative
6 commentsusers have commented on this narrative
18 likesusers have liked this narrative
TH

TheWallstreetKing on MicroVision ·
MicroVision will explode future revenue by 380.37% with a vision towards success
Fair Value:US$6098.4% undervalued
86 followersusers have followed this narrative
11 commentsusers have commented on this narrative
18 likesusers have liked this narrative
AN


AnalystConsensusTarget on NVIDIA ·
NVDA: Expanding AI Demand Will Drive Major Data Center Investments Through 2026
Fair Value:US$232.7923.6% undervalued
923 followersusers have followed this narrative
5 commentsusers have commented on this narrative
22 likesusers have liked this narrative