
Advertisement
- South Korea
- /
- Electronic Equipment and Components
- /
- KOSDAQ:A347000
Does Senko (KOSDAQ:347000) Have A Healthy Balance Sheet?
David Iben put it well when he said, 'Volatility is not a risk we care about. What we care about is avoiding the permanent loss of capital.' So it might be obvious that you need to consider debt, when you think about how risky any given stock is, because too much debt can sink a company. We can see that Senko Co., Ltd (KOSDAQ:347000) does use debt in its business. But is this debt a concern to shareholders?
We've discovered 2 warning signs about Senko. View them for free.When Is Debt A Problem?
Debt assists a business until the business has trouble paying it off, either with new capital or with free cash flow. Ultimately, if the company can't fulfill its legal obligations to repay debt, shareholders could walk away with nothing. However, a more usual (but still expensive) situation is where a company must dilute shareholders at a cheap share price simply to get debt under control. Having said that, the most common situation is where a company manages its debt reasonably well - and to its own advantage. The first thing to do when considering how much debt a business uses is to look at its cash and debt together.
What Is Senko's Debt?
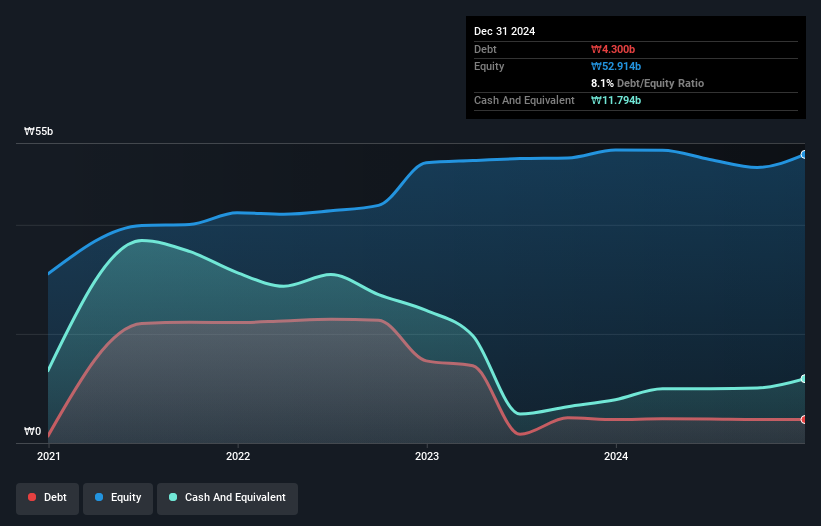
As you can see below, Senko had ₩4.30b of debt, at December 2024, which is about the same as the year before. You can click the chart for greater detail. But on the other hand it also has ₩11.8b in cash, leading to a ₩7.49b net cash position.
How Strong Is Senko's Balance Sheet?
Zooming in on the latest balance sheet data, we can see that Senko had liabilities of ₩9.79b due within 12 months and liabilities of ₩4.31b due beyond that. Offsetting this, it had ₩11.8b in cash and ₩5.81b in receivables that were due within 12 months. So it can boast ₩3.50b more liquid assets than total liabilities.
This short term liquidity is a sign that Senko could probably pay off its debt with ease, as its balance sheet is far from stretched. Simply put, the fact that Senko has more cash than debt is arguably a good indication that it can manage its debt safely.
View our latest analysis for Senko
We note that Senko grew its EBIT by 22% in the last year, and that should make it easier to pay down debt, going forward. When analysing debt levels, the balance sheet is the obvious place to start. But you can't view debt in total isolation; since Senko will need earnings to service that debt. So when considering debt, it's definitely worth looking at the earnings trend. Click here for an interactive snapshot.
But our final consideration is also important, because a company cannot pay debt with paper profits; it needs cold hard cash. While Senko has net cash on its balance sheet, it's still worth taking a look at its ability to convert earnings before interest and tax (EBIT) to free cash flow, to help us understand how quickly it is building (or eroding) that cash balance. Over the last three years, Senko saw substantial negative free cash flow, in total. While that may be a result of expenditure for growth, it does make the debt far more risky.
Summing Up
While it is always sensible to investigate a company's debt, in this case Senko has ₩7.49b in net cash and a decent-looking balance sheet. And we liked the look of last year's 22% year-on-year EBIT growth. So we are not troubled with Senko's debt use. The balance sheet is clearly the area to focus on when you are analysing debt. But ultimately, every company can contain risks that exist outside of the balance sheet. We've identified 2 warning signs with Senko (at least 1 which is a bit concerning) , and understanding them should be part of your investment process.
If you're interested in investing in businesses that can grow profits without the burden of debt, then check out this free list of growing businesses that have net cash on the balance sheet.
New: Manage All Your Stock Portfolios in One Place
We've created the ultimate portfolio companion for stock investors, and it's free.
• Connect an unlimited number of Portfolios and see your total in one currency
• Be alerted to new Warning Signs or Risks via email or mobile
• Track the Fair Value of your stocks
Have feedback on this article? Concerned about the content? Get in touch with us directly. Alternatively, email editorial-team (at) simplywallst.com.
This article by Simply Wall St is general in nature. We provide commentary based on historical data and analyst forecasts only using an unbiased methodology and our articles are not intended to be financial advice. It does not constitute a recommendation to buy or sell any stock, and does not take account of your objectives, or your financial situation. We aim to bring you long-term focused analysis driven by fundamental data. Note that our analysis may not factor in the latest price-sensitive company announcements or qualitative material. Simply Wall St has no position in any stocks mentioned.
About KOSDAQ:A347000
Senko
Engages in the research, development, production, and sale of electrochemical gas sensors and related devices in South Korea and internationally.
Excellent balance sheet with slight risk.
Market Insights

Advertisement
Community Narratives
MicroVision will explode future revenue by 380.37% with a vision towards success
Fair Value US$60|98.4% undervalued
TH
Community Contributor
The Indispensable Artery for a New North American Economy
Fair Value CA$132.87|1.6% undervalued
TI
Community Contributor
Recently Updated Narratives
BE


Bejgal on MINISO Group Holding ·
MINISO's fair value is projected at 26.69 with an anticipated PE ratio shift of 20x
Fair Value:US$26.6928.0% undervalued
44 followersusers have followed this narrative
3 commentsusers have commented on this narrative
0 likesusers have liked this narrative
TI


TickerTickle on Oracle ·
The Quiet Giant That Became AI’s Power Grid
Fair Value:US$389.8149.5% undervalued
7 followersusers have followed this narrative
1 commentusers have commented on this narrative
0 likesusers have liked this narrative
AU

AuCA on Nova Ljubljanska Banka d.d ·
Nova Ljubljanska Banka d.d will expect a 11.2% revenue boost driving future growth
Fair Value:€20916.5% undervalued
23 followersusers have followed this narrative
3 commentsusers have commented on this narrative
0 likesusers have liked this narrative
Popular Narratives
OS


oscargarcia on Alphabet ·
The company that turned a verb into a global necessity and basically runs the modern internet, digital ads, smartphones, maps, and AI.
Fair Value:US$3404.9% undervalued
136 followersusers have followed this narrative
6 commentsusers have commented on this narrative
18 likesusers have liked this narrative
TH

TheWallstreetKing on MicroVision ·
MicroVision will explode future revenue by 380.37% with a vision towards success
Fair Value:US$6098.4% undervalued
87 followersusers have followed this narrative
11 commentsusers have commented on this narrative
18 likesusers have liked this narrative
AN


AnalystConsensusTarget on NVIDIA ·
NVDA: Expanding AI Demand Will Drive Major Data Center Investments Through 2026
Fair Value:US$232.7923.6% undervalued
925 followersusers have followed this narrative
6 commentsusers have commented on this narrative
22 likesusers have liked this narrative