
Advertisement
- South Korea
- /
- Electronic Equipment and Components
- /
- KOSDAQ:A252990
Does SEMCNS (KOSDAQ:252990) Have A Healthy Balance Sheet?
Legendary fund manager Li Lu (who Charlie Munger backed) once said, 'The biggest investment risk is not the volatility of prices, but whether you will suffer a permanent loss of capital.' When we think about how risky a company is, we always like to look at its use of debt, since debt overload can lead to ruin. We can see that SEMCNS Co., Ltd. (KOSDAQ:252990) does use debt in its business. But the real question is whether this debt is making the company risky.
Why Does Debt Bring Risk?
Generally speaking, debt only becomes a real problem when a company can't easily pay it off, either by raising capital or with its own cash flow. If things get really bad, the lenders can take control of the business. However, a more frequent (but still costly) occurrence is where a company must issue shares at bargain-basement prices, permanently diluting shareholders, just to shore up its balance sheet. Of course, plenty of companies use debt to fund growth, without any negative consequences. When we examine debt levels, we first consider both cash and debt levels, together.
See our latest analysis for SEMCNS
What Is SEMCNS's Net Debt?
You can click the graphic below for the historical numbers, but it shows that SEMCNS had ₩63.5b of debt in March 2024, down from ₩70.4b, one year before. However, it does have ₩20.8b in cash offsetting this, leading to net debt of about ₩42.7b.
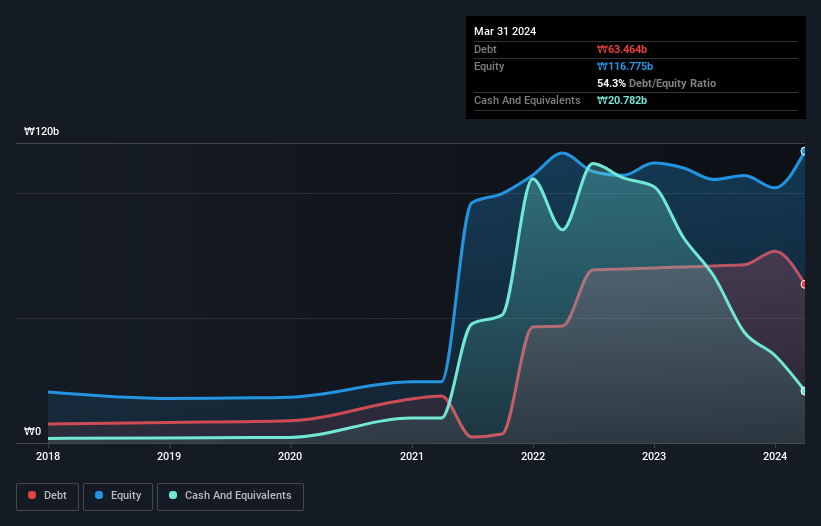
How Healthy Is SEMCNS' Balance Sheet?
The latest balance sheet data shows that SEMCNS had liabilities of ₩47.0b due within a year, and liabilities of ₩25.9b falling due after that. Offsetting this, it had ₩20.8b in cash and ₩5.57b in receivables that were due within 12 months. So its liabilities total ₩46.6b more than the combination of its cash and short-term receivables.
Of course, SEMCNS has a market capitalization of ₩389.4b, so these liabilities are probably manageable. However, we do think it is worth keeping an eye on its balance sheet strength, as it may change over time. The balance sheet is clearly the area to focus on when you are analysing debt. But it is SEMCNS's earnings that will influence how the balance sheet holds up in the future. So when considering debt, it's definitely worth looking at the earnings trend. Click here for an interactive snapshot.
In the last year SEMCNS had a loss before interest and tax, and actually shrunk its revenue by 18%, to ₩34b. We would much prefer see growth.
Caveat Emptor
While SEMCNS's falling revenue is about as heartwarming as a wet blanket, arguably its earnings before interest and tax (EBIT) loss is even less appealing. To be specific the EBIT loss came in at ₩2.7b. Considering that alongside the liabilities mentioned above does not give us much confidence that company should be using so much debt. So we think its balance sheet is a little strained, though not beyond repair. Another cause for caution is that is bled ₩69b in negative free cash flow over the last twelve months. So in short it's a really risky stock. When analysing debt levels, the balance sheet is the obvious place to start. But ultimately, every company can contain risks that exist outside of the balance sheet. For example SEMCNS has 3 warning signs (and 1 which is a bit concerning) we think you should know about.
When all is said and done, sometimes its easier to focus on companies that don't even need debt. Readers can access a list of growth stocks with zero net debt 100% free, right now.
New: Manage All Your Stock Portfolios in One Place
We've created the ultimate portfolio companion for stock investors, and it's free.
• Connect an unlimited number of Portfolios and see your total in one currency
• Be alerted to new Warning Signs or Risks via email or mobile
• Track the Fair Value of your stocks
Have feedback on this article? Concerned about the content? Get in touch with us directly. Alternatively, email editorial-team (at) simplywallst.com.
This article by Simply Wall St is general in nature. We provide commentary based on historical data and analyst forecasts only using an unbiased methodology and our articles are not intended to be financial advice. It does not constitute a recommendation to buy or sell any stock, and does not take account of your objectives, or your financial situation. We aim to bring you long-term focused analysis driven by fundamental data. Note that our analysis may not factor in the latest price-sensitive company announcements or qualitative material. Simply Wall St has no position in any stocks mentioned.
Have feedback on this article? Concerned about the content? Get in touch with us directly. Alternatively, email editorial-team@simplywallst.com
About KOSDAQ:A252990
Excellent balance sheet with proven track record.
Market Insights

Advertisement
Community Narratives
MicroVision will explode future revenue by 380.37% with a vision towards success
Fair Value US$60.00|98.4% undervalued
TH
Community Contributor
The Indispensable Artery for a New North American Economy
Fair Value CA$132.87|1.3% undervalued
TI
Community Contributor