
Advertisement
- South Korea
- /
- Electronic Equipment and Components
- /
- KOSDAQ:A200230
TELCON RF PHARMACEUTICAL. Inc.'s (KOSDAQ:200230) 35% Price Boost Is Out Of Tune With Revenues
TELCON RF PHARMACEUTICAL. Inc. (KOSDAQ:200230) shares have continued their recent momentum with a 35% gain in the last month alone. Unfortunately, the gains of the last month did little to right the losses of the last year with the stock still down 14% over that time.
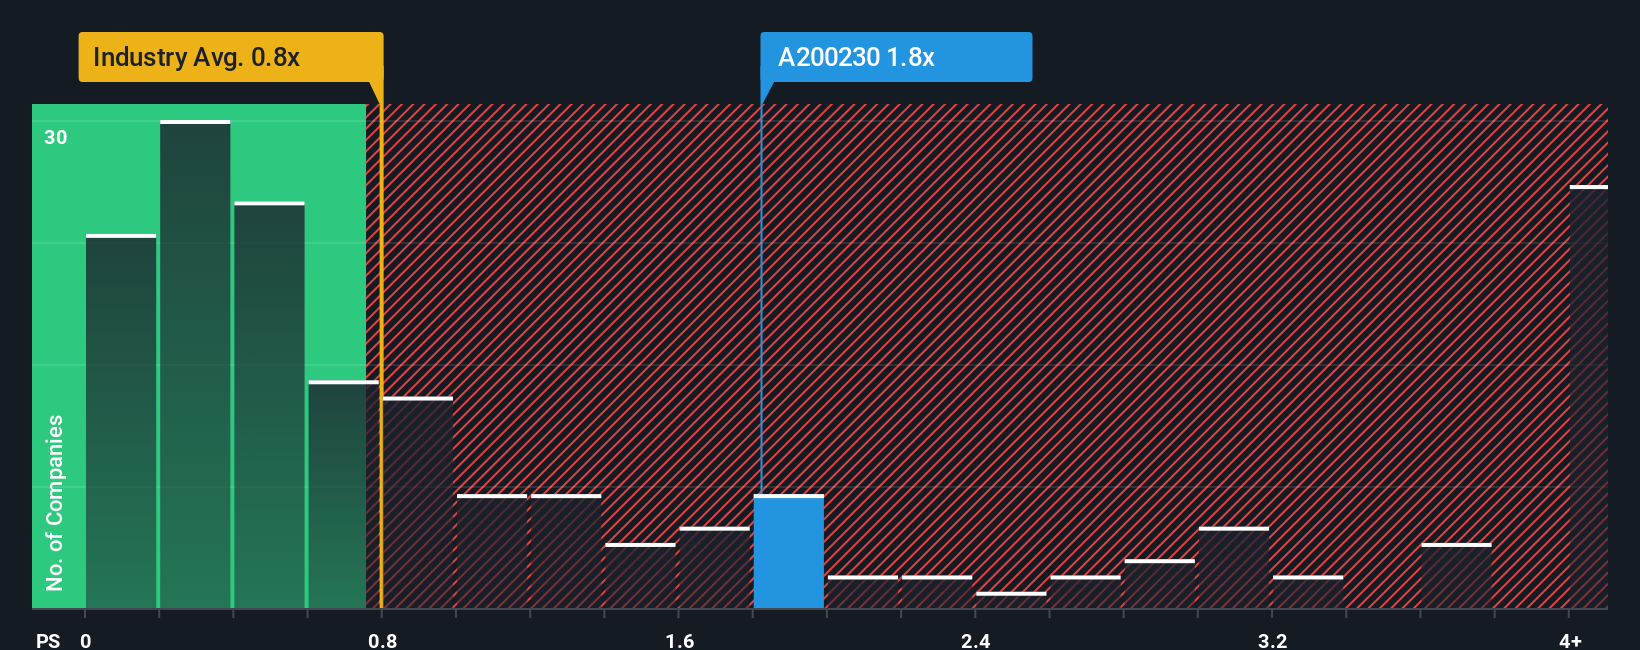
Following the firm bounce in price, given close to half the companies operating in Korea's Electronic industry have price-to-sales ratios (or "P/S") below 0.8x, you may consider TELCON RF PHARMACEUTICAL as a stock to potentially avoid with its 1.8x P/S ratio. Although, it's not wise to just take the P/S at face value as there may be an explanation why it's as high as it is.
See our latest analysis for TELCON RF PHARMACEUTICAL
What Does TELCON RF PHARMACEUTICAL's Recent Performance Look Like?
TELCON RF PHARMACEUTICAL has been doing a decent job lately as it's been growing revenue at a reasonable pace. It might be that many expect the reasonable revenue performance to beat most other companies over the coming period, which has increased investors’ willingness to pay up for the stock. However, if this isn't the case, investors might get caught out paying too much for the stock.
Want the full picture on earnings, revenue and cash flow for the company? Then our free report on TELCON RF PHARMACEUTICAL will help you shine a light on its historical performance.How Is TELCON RF PHARMACEUTICAL's Revenue Growth Trending?
TELCON RF PHARMACEUTICAL's P/S ratio would be typical for a company that's expected to deliver solid growth, and importantly, perform better than the industry.
Retrospectively, the last year delivered a decent 7.1% gain to the company's revenues. The latest three year period has also seen a 15% overall rise in revenue, aided somewhat by its short-term performance. So we can start by confirming that the company has actually done a good job of growing revenue over that time.
Comparing the recent medium-term revenue trends against the industry's one-year growth forecast of 16% shows it's noticeably less attractive.
With this information, we find it concerning that TELCON RF PHARMACEUTICAL is trading at a P/S higher than the industry. It seems most investors are ignoring the fairly limited recent growth rates and are hoping for a turnaround in the company's business prospects. Only the boldest would assume these prices are sustainable as a continuation of recent revenue trends is likely to weigh heavily on the share price eventually.
What Does TELCON RF PHARMACEUTICAL's P/S Mean For Investors?
TELCON RF PHARMACEUTICAL's P/S is on the rise since its shares have risen strongly. It's argued the price-to-sales ratio is an inferior measure of value within certain industries, but it can be a powerful business sentiment indicator.
The fact that TELCON RF PHARMACEUTICAL currently trades on a higher P/S relative to the industry is an oddity, since its recent three-year growth is lower than the wider industry forecast. When we see slower than industry revenue growth but an elevated P/S, there's considerable risk of the share price declining, sending the P/S lower. Unless the recent medium-term conditions improve markedly, it's very challenging to accept these the share price as being reasonable.
Before you settle on your opinion, we've discovered 2 warning signs for TELCON RF PHARMACEUTICAL (1 is concerning!) that you should be aware of.
It's important to make sure you look for a great company, not just the first idea you come across. So if growing profitability aligns with your idea of a great company, take a peek at this free list of interesting companies with strong recent earnings growth (and a low P/E).
Valuation is complex, but we're here to simplify it.
Discover if TELCON RF PHARMACEUTICAL might be undervalued or overvalued with our detailed analysis, featuring fair value estimates, potential risks, dividends, insider trades, and its financial condition.
Access Free AnalysisHave feedback on this article? Concerned about the content? Get in touch with us directly. Alternatively, email editorial-team (at) simplywallst.com.
This article by Simply Wall St is general in nature. We provide commentary based on historical data and analyst forecasts only using an unbiased methodology and our articles are not intended to be financial advice. It does not constitute a recommendation to buy or sell any stock, and does not take account of your objectives, or your financial situation. We aim to bring you long-term focused analysis driven by fundamental data. Note that our analysis may not factor in the latest price-sensitive company announcements or qualitative material. Simply Wall St has no position in any stocks mentioned.
About KOSDAQ:A200230
TELCON RF PHARMACEUTICAL
Primarily engages in the development, production, and sale of RF coaxial connectors worldwide.
Mediocre balance sheet with very low risk.
Market Insights

Advertisement
Community Narratives
The company that turned a verb into a global necessity and basically runs the modern internet, digital ads, smartphones, maps, and AI.
Fair Value US$300.00|6.3% undervalued
OS
Community Contributor
Flowers Foods Pays A Fair Price For Health
Fair Value US$16.12|26.0% undervalued
NV
Community Contributor
TMX Group will thrive with 33.3% profit margin and enduring market moat
Fair Value CA$49.90|3.7% overvalued
LI
Community Contributor