
Advertisement
- South Korea
- /
- Tech Hardware
- /
- KOSDAQ:A096630
Some Investors May Be Worried About S Connect's (KOSDAQ:096630) Returns On Capital
If you're looking at a mature business that's past the growth phase, what are some of the underlying trends that pop up? A business that's potentially in decline often shows two trends, a return on capital employed (ROCE) that's declining, and a base of capital employed that's also declining. This reveals that the company isn't compounding shareholder wealth because returns are falling and its net asset base is shrinking. Having said that, after a brief look, S Connect (KOSDAQ:096630) we aren't filled with optimism, but let's investigate further.
What Is Return On Capital Employed (ROCE)?
Just to clarify if you're unsure, ROCE is a metric for evaluating how much pre-tax income (in percentage terms) a company earns on the capital invested in its business. The formula for this calculation on S Connect is:
Return on Capital Employed = Earnings Before Interest and Tax (EBIT) ÷ (Total Assets - Current Liabilities)
0.066 = ₩6.3b ÷ (₩206b - ₩111b) (Based on the trailing twelve months to December 2023).
So, S Connect has an ROCE of 6.6%. In absolute terms, that's a low return but it's around the Tech industry average of 5.6%.
Check out our latest analysis for S Connect
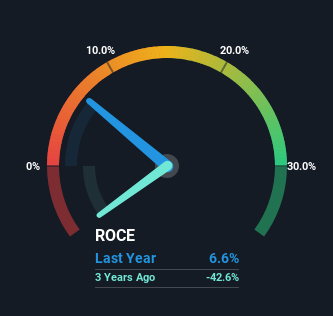
Historical performance is a great place to start when researching a stock so above you can see the gauge for S Connect's ROCE against it's prior returns. If you'd like to look at how S Connect has performed in the past in other metrics, you can view this free graph of S Connect's past earnings, revenue and cash flow.
What Can We Tell From S Connect's ROCE Trend?
There is reason to be cautious about S Connect, given the returns are trending downwards. To be more specific, the ROCE was 15% five years ago, but since then it has dropped noticeably. And on the capital employed front, the business is utilizing roughly the same amount of capital as it was back then. Companies that exhibit these attributes tend to not be shrinking, but they can be mature and facing pressure on their margins from competition. So because these trends aren't typically conducive to creating a multi-bagger, we wouldn't hold our breath on S Connect becoming one if things continue as they have.
On a side note, S Connect's current liabilities have increased over the last five years to 54% of total assets, effectively distorting the ROCE to some degree. If current liabilities hadn't increased as much as they did, the ROCE could actually be even lower. And with current liabilities at these levels, suppliers or short-term creditors are effectively funding a large part of the business, which can introduce some risks.
The Bottom Line On S Connect's ROCE
In the end, the trend of lower returns on the same amount of capital isn't typically an indication that we're looking at a growth stock. It should come as no surprise then that the stock has fallen 11% over the last five years, so it looks like investors are recognizing these changes. With underlying trends that aren't great in these areas, we'd consider looking elsewhere.
One more thing to note, we've identified 2 warning signs with S Connect and understanding them should be part of your investment process.
If you want to search for solid companies with great earnings, check out this free list of companies with good balance sheets and impressive returns on equity.
New: Manage All Your Stock Portfolios in One Place
We've created the ultimate portfolio companion for stock investors, and it's free.
• Connect an unlimited number of Portfolios and see your total in one currency
• Be alerted to new Warning Signs or Risks via email or mobile
• Track the Fair Value of your stocks
Have feedback on this article? Concerned about the content? Get in touch with us directly. Alternatively, email editorial-team (at) simplywallst.com.
This article by Simply Wall St is general in nature. We provide commentary based on historical data and analyst forecasts only using an unbiased methodology and our articles are not intended to be financial advice. It does not constitute a recommendation to buy or sell any stock, and does not take account of your objectives, or your financial situation. We aim to bring you long-term focused analysis driven by fundamental data. Note that our analysis may not factor in the latest price-sensitive company announcements or qualitative material. Simply Wall St has no position in any stocks mentioned.
About KOSDAQ:A096630
S Connect
Produces and sells various metal processing parts of IT products in South Korea and internationally.
Adequate balance sheet and slightly overvalued.
Market Insights

Advertisement
Community Narratives
The company that turned a verb into a global necessity and basically runs the modern internet, digital ads, smartphones, maps, and AI.
Fair Value US$300.00|6.2% undervalued
OS
Community Contributor
Flowers Foods Pays A Fair Price For Health
Fair Value US$16.12|25.1% undervalued
NV
Community Contributor
TMX Group will thrive with 33.3% profit margin and enduring market moat
Fair Value CA$49.90|0.04% overvalued
LI
Community Contributor