
Advertisement
- South Korea
- /
- Electronic Equipment and Components
- /
- KOSDAQ:A092460
These 4 Measures Indicate That Hanla IMS (KOSDAQ:092460) Is Using Debt Safely
Howard Marks put it nicely when he said that, rather than worrying about share price volatility, 'The possibility of permanent loss is the risk I worry about... and every practical investor I know worries about.' It's only natural to consider a company's balance sheet when you examine how risky it is, since debt is often involved when a business collapses. We note that Hanla IMS Co., Ltd. (KOSDAQ:092460) does have debt on its balance sheet. But the more important question is: how much risk is that debt creating?
When Is Debt Dangerous?
Debt is a tool to help businesses grow, but if a business is incapable of paying off its lenders, then it exists at their mercy. In the worst case scenario, a company can go bankrupt if it cannot pay its creditors. However, a more usual (but still expensive) situation is where a company must dilute shareholders at a cheap share price simply to get debt under control. By replacing dilution, though, debt can be an extremely good tool for businesses that need capital to invest in growth at high rates of return. The first step when considering a company's debt levels is to consider its cash and debt together.
What Is Hanla IMS's Debt?
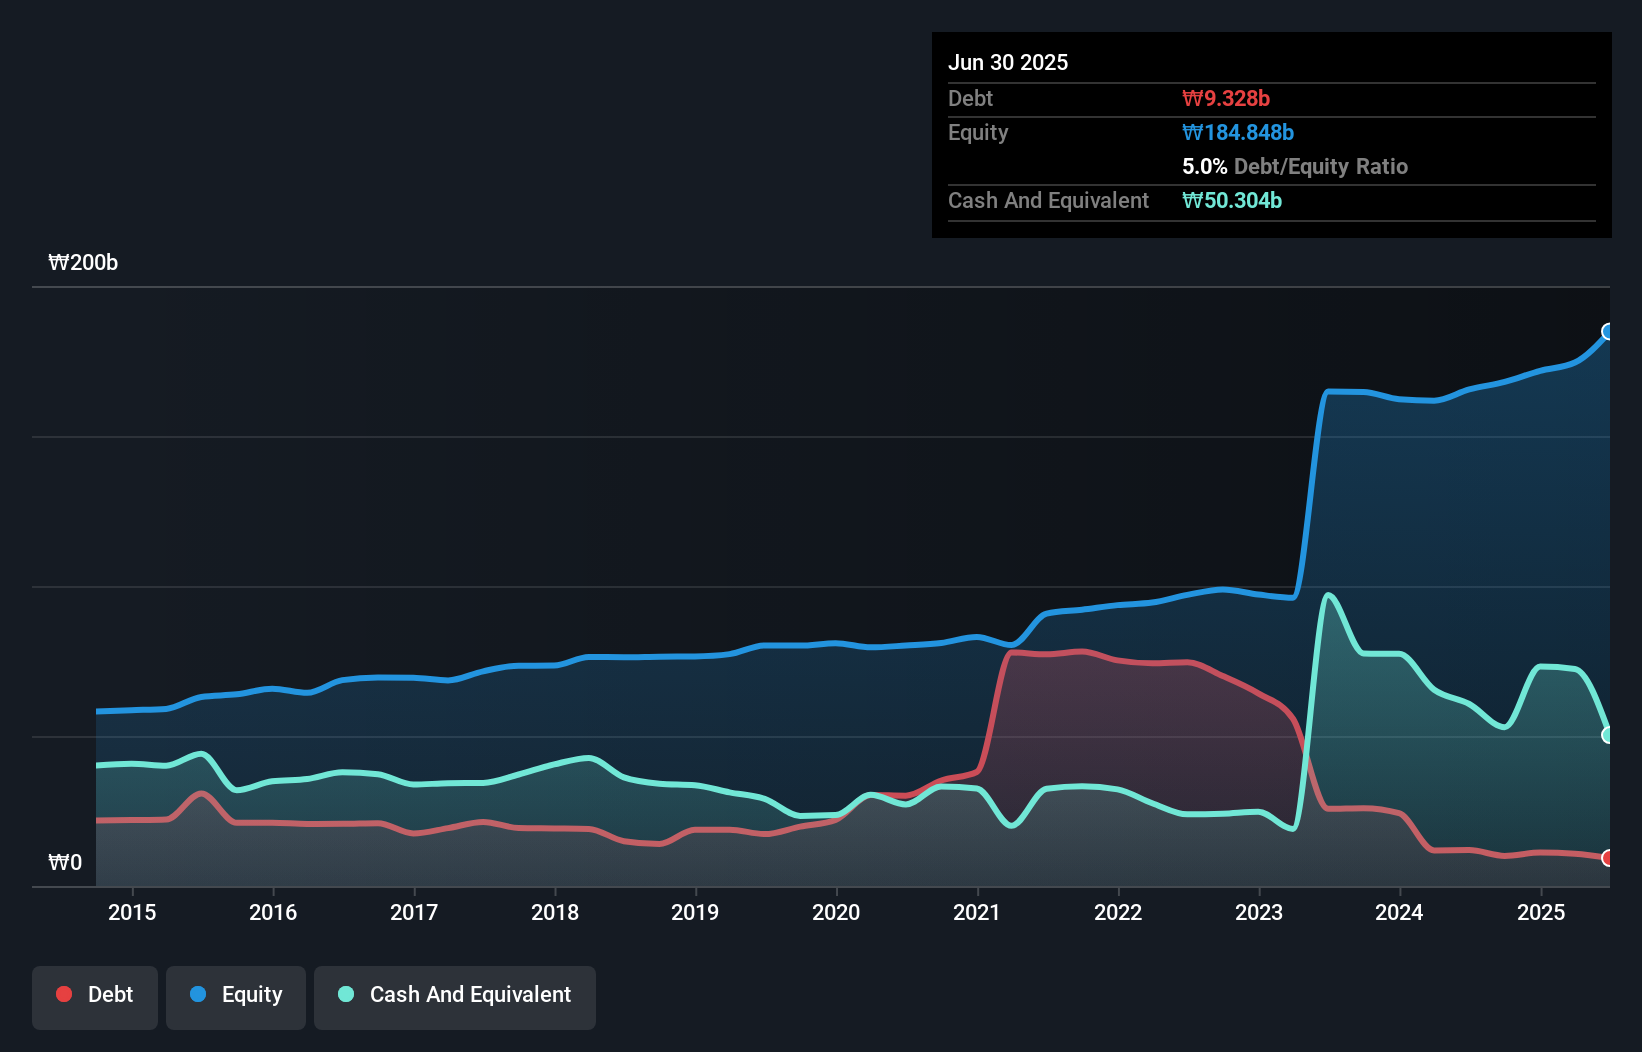
You can click the graphic below for the historical numbers, but it shows that Hanla IMS had ₩9.33b of debt in June 2025, down from ₩12.0b, one year before. But it also has ₩50.3b in cash to offset that, meaning it has ₩41.0b net cash.
A Look At Hanla IMS' Liabilities
According to the last reported balance sheet, Hanla IMS had liabilities of ₩33.8b due within 12 months, and liabilities of ₩2.12b due beyond 12 months. On the other hand, it had cash of ₩50.3b and ₩16.1b worth of receivables due within a year. So it actually has ₩30.5b more liquid assets than total liabilities.
This surplus suggests that Hanla IMS has a conservative balance sheet, and could probably eliminate its debt without much difficulty. Simply put, the fact that Hanla IMS has more cash than debt is arguably a good indication that it can manage its debt safely.
See our latest analysis for Hanla IMS
On top of that, Hanla IMS grew its EBIT by 77% over the last twelve months, and that growth will make it easier to handle its debt. When analysing debt levels, the balance sheet is the obvious place to start. But it is Hanla IMS's earnings that will influence how the balance sheet holds up in the future. So when considering debt, it's definitely worth looking at the earnings trend. Click here for an interactive snapshot.
Finally, a company can only pay off debt with cold hard cash, not accounting profits. Hanla IMS may have net cash on the balance sheet, but it is still interesting to look at how well the business converts its earnings before interest and tax (EBIT) to free cash flow, because that will influence both its need for, and its capacity to manage debt. In the last three years, Hanla IMS created free cash flow amounting to 18% of its EBIT, an uninspiring performance. For us, cash conversion that low sparks a little paranoia about is ability to extinguish debt.
Summing Up
While we empathize with investors who find debt concerning, you should keep in mind that Hanla IMS has net cash of ₩41.0b, as well as more liquid assets than liabilities. And we liked the look of last year's 77% year-on-year EBIT growth. So is Hanla IMS's debt a risk? It doesn't seem so to us. The balance sheet is clearly the area to focus on when you are analysing debt. However, not all investment risk resides within the balance sheet - far from it. Be aware that Hanla IMS is showing 2 warning signs in our investment analysis , and 1 of those can't be ignored...
If you're interested in investing in businesses that can grow profits without the burden of debt, then check out this free list of growing businesses that have net cash on the balance sheet.
Valuation is complex, but we're here to simplify it.
Discover if Hanla IMS might be undervalued or overvalued with our detailed analysis, featuring fair value estimates, potential risks, dividends, insider trades, and its financial condition.
Access Free AnalysisHave feedback on this article? Concerned about the content? Get in touch with us directly. Alternatively, email editorial-team (at) simplywallst.com.
This article by Simply Wall St is general in nature. We provide commentary based on historical data and analyst forecasts only using an unbiased methodology and our articles are not intended to be financial advice. It does not constitute a recommendation to buy or sell any stock, and does not take account of your objectives, or your financial situation. We aim to bring you long-term focused analysis driven by fundamental data. Note that our analysis may not factor in the latest price-sensitive company announcements or qualitative material. Simply Wall St has no position in any stocks mentioned.
About KOSDAQ:A092460
Hanla IMS
Provides integrated systems in South Korea, Singapore, China, and internationally.
Flawless balance sheet with solid track record.
Market Insights

Advertisement
Community Narratives
MicroVision will explode future revenue by 380.37% with a vision towards success
Fair Value US$60|98.4% undervalued
TH
Community Contributor
The Indispensable Artery for a New North American Economy
Fair Value CA$132.87|1.6% undervalued
TI
Community Contributor
Recently Updated Narratives
BE


Bejgal on MINISO Group Holding ·
MINISO's fair value is projected at 26.69 with an anticipated PE ratio shift of 20x
Fair Value:US$26.6928.0% undervalued
44 followersusers have followed this narrative
3 commentsusers have commented on this narrative
0 likesusers have liked this narrative
TI


TickerTickle on Oracle ·
The Quiet Giant That Became AI’s Power Grid
Fair Value:US$389.8149.5% undervalued
7 followersusers have followed this narrative
1 commentusers have commented on this narrative
0 likesusers have liked this narrative
AU

AuCA on Nova Ljubljanska Banka d.d ·
Nova Ljubljanska Banka d.d will expect a 11.2% revenue boost driving future growth
Fair Value:€20916.3% undervalued
23 followersusers have followed this narrative
3 commentsusers have commented on this narrative
0 likesusers have liked this narrative
Popular Narratives
OS


oscargarcia on Alphabet ·
The company that turned a verb into a global necessity and basically runs the modern internet, digital ads, smartphones, maps, and AI.
Fair Value:US$3404.9% undervalued
134 followersusers have followed this narrative
6 commentsusers have commented on this narrative
18 likesusers have liked this narrative
TH

TheWallstreetKing on MicroVision ·
MicroVision will explode future revenue by 380.37% with a vision towards success
Fair Value:US$6098.4% undervalued
83 followersusers have followed this narrative
11 commentsusers have commented on this narrative
18 likesusers have liked this narrative
AN


AnalystConsensusTarget on NVIDIA ·
NVDA: Expanding AI Demand Will Drive Major Data Center Investments Through 2026
Fair Value:US$232.7923.6% undervalued
923 followersusers have followed this narrative
5 commentsusers have commented on this narrative
22 likesusers have liked this narrative