- South Korea
- /
- Electronic Equipment and Components
- /
- KOSDAQ:A089980
Investors more bullish on Sang-A FrontecLtd (KOSDAQ:089980) this week as stock surges 15%, despite earnings trending downwards over past five years


Stock pickers are generally looking for stocks that will outperform the broader market. And while active stock picking involves risks (and requires diversification) it can also provide excess returns. For example, long term Sang-A Frontec Co.,Ltd. (KOSDAQ:089980) shareholders have enjoyed a 65% share price rise over the last half decade, well in excess of the market return of around 35% (not including dividends).
The past week has proven to be lucrative for Sang-A FrontecLtd investors, so let's see if fundamentals drove the company's five-year performance.
View our latest analysis for Sang-A FrontecLtd
While markets are a powerful pricing mechanism, share prices reflect investor sentiment, not just underlying business performance. One imperfect but simple way to consider how the market perception of a company has shifted is to compare the change in the earnings per share (EPS) with the share price movement.
Sang-A FrontecLtd's earnings per share are down 8.5% per year, despite strong share price performance over five years.
Essentially, it doesn't seem likely that investors are focused on EPS. Because earnings per share don't seem to match up with the share price, we'll take a look at other metrics instead.
We doubt the modest 0.7% dividend yield is attracting many buyers to the stock. The revenue growth of 0.4% per year hardly seems impressive. So why is the share price up? It's not immediately obvious to us, but a closer look at the company's progress over time might yield answers.
The company's revenue and earnings (over time) are depicted in the image below (click to see the exact numbers).
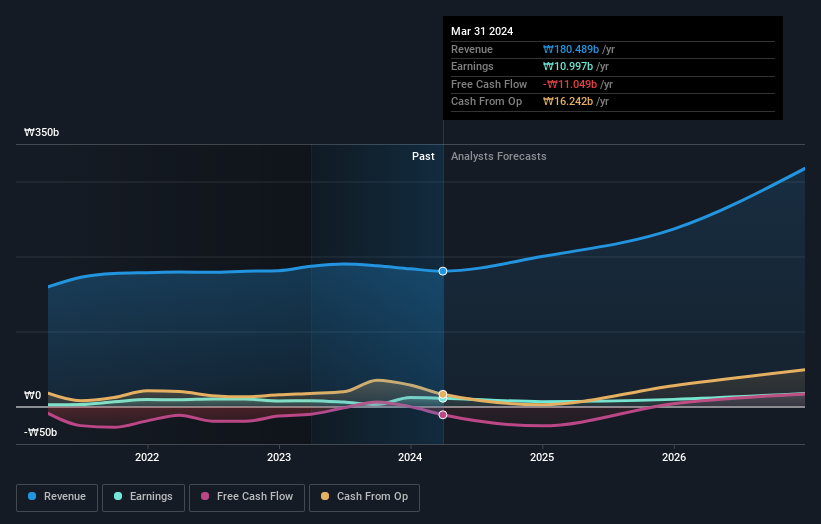
We know that Sang-A FrontecLtd has improved its bottom line over the last three years, but what does the future have in store? If you are thinking of buying or selling Sang-A FrontecLtd stock, you should check out this FREE detailed report on its balance sheet.
What About Dividends?
It is important to consider the total shareholder return, as well as the share price return, for any given stock. The TSR is a return calculation that accounts for the value of cash dividends (assuming that any dividend received was reinvested) and the calculated value of any discounted capital raisings and spin-offs. Arguably, the TSR gives a more comprehensive picture of the return generated by a stock. We note that for Sang-A FrontecLtd the TSR over the last 5 years was 71%, which is better than the share price return mentioned above. And there's no prize for guessing that the dividend payments largely explain the divergence!
A Different Perspective
Investors in Sang-A FrontecLtd had a tough year, with a total loss of 2.9% (including dividends), against a market gain of about 8.6%. Even the share prices of good stocks drop sometimes, but we want to see improvements in the fundamental metrics of a business, before getting too interested. Longer term investors wouldn't be so upset, since they would have made 11%, each year, over five years. It could be that the recent sell-off is an opportunity, so it may be worth checking the fundamental data for signs of a long term growth trend. It's always interesting to track share price performance over the longer term. But to understand Sang-A FrontecLtd better, we need to consider many other factors. Consider risks, for instance. Every company has them, and we've spotted 1 warning sign for Sang-A FrontecLtd you should know about.
For those who like to find winning investments this free list of undervalued companies with recent insider purchasing, could be just the ticket.
Please note, the market returns quoted in this article reflect the market weighted average returns of stocks that currently trade on South Korean exchanges.
New: Manage All Your Stock Portfolios in One Place
We've created the ultimate portfolio companion for stock investors, and it's free.
• Connect an unlimited number of Portfolios and see your total in one currency
• Be alerted to new Warning Signs or Risks via email or mobile
• Track the Fair Value of your stocks
Have feedback on this article? Concerned about the content? Get in touch with us directly. Alternatively, email editorial-team (at) simplywallst.com.
This article by Simply Wall St is general in nature. We provide commentary based on historical data and analyst forecasts only using an unbiased methodology and our articles are not intended to be financial advice. It does not constitute a recommendation to buy or sell any stock, and does not take account of your objectives, or your financial situation. We aim to bring you long-term focused analysis driven by fundamental data. Note that our analysis may not factor in the latest price-sensitive company announcements or qualitative material. Simply Wall St has no position in any stocks mentioned.
Have feedback on this article? Concerned about the content? Get in touch with us directly. Alternatively, email editorial-team@simplywallst.com
About KOSDAQ:A089980
Sang-A FrontecLtd
Engages in the research and development, production, and sale of materials/parts based on engineering plastics in South Korea and internationally.
High growth potential with proven track record.

