
Advertisement
- South Korea
- /
- Electronic Equipment and Components
- /
- KOSDAQ:A085670
NewFlex Technology Co., Ltd.'s (KOSDAQ:085670) Fundamentals Look Pretty Strong: Could The Market Be Wrong About The Stock?
It is hard to get excited after looking at NewFlex Technology's (KOSDAQ:085670) recent performance, when its stock has declined 11% over the past week. However, stock prices are usually driven by a company’s financial performance over the long term, which in this case looks quite promising. In this article, we decided to focus on NewFlex Technology's ROE.
Return on Equity or ROE is a test of how effectively a company is growing its value and managing investors’ money. In short, ROE shows the profit each dollar generates with respect to its shareholder investments.
How Is ROE Calculated?
The formula for return on equity is:
Return on Equity = Net Profit (from continuing operations) ÷ Shareholders' Equity
So, based on the above formula, the ROE for NewFlex Technology is:
9.1% = ₩9.1b ÷ ₩100b (Based on the trailing twelve months to June 2025).
The 'return' is the income the business earned over the last year. One way to conceptualize this is that for each ₩1 of shareholders' capital it has, the company made ₩0.09 in profit.
Check out our latest analysis for NewFlex Technology
What Has ROE Got To Do With Earnings Growth?
We have already established that ROE serves as an efficient profit-generating gauge for a company's future earnings. Based on how much of its profits the company chooses to reinvest or "retain", we are then able to evaluate a company's future ability to generate profits. Assuming everything else remains unchanged, the higher the ROE and profit retention, the higher the growth rate of a company compared to companies that don't necessarily bear these characteristics.
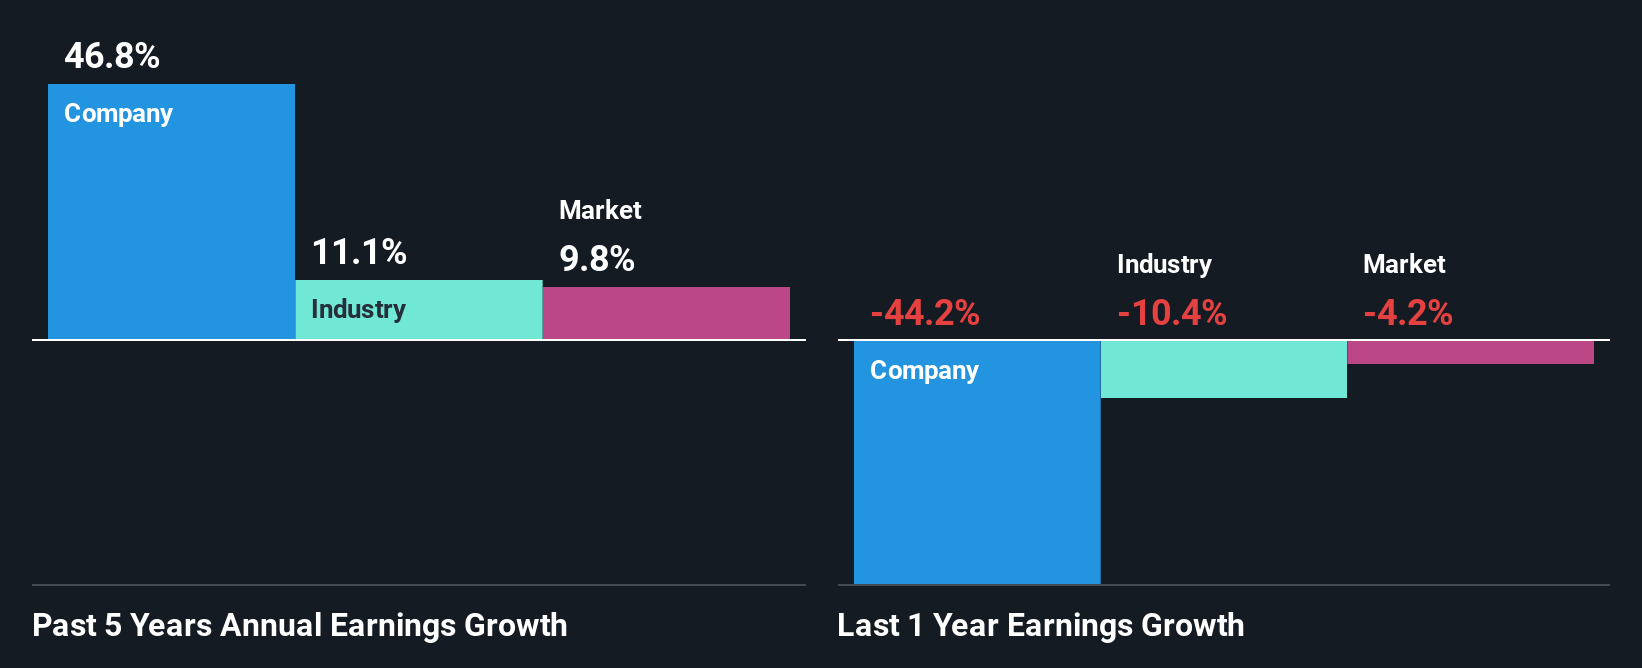
NewFlex Technology's Earnings Growth And 9.1% ROE
On the face of it, NewFlex Technology's ROE is not much to talk about. However, the fact that the company's ROE is higher than the average industry ROE of 6.3%, is definitely interesting. Especially when you consider NewFlex Technology's exceptional 47% net income growth over the past five years. Bear in mind, the company does have a moderately low ROE. It is just that the industry ROE is lower. So, there might well be other reasons for the earnings to grow. Such as- high earnings retention or the company belonging to a high growth industry.
As a next step, we compared NewFlex Technology's net income growth with the industry, and pleasingly, we found that the growth seen by the company is higher than the average industry growth of 11%.
The basis for attaching value to a company is, to a great extent, tied to its earnings growth. The investor should try to establish if the expected growth or decline in earnings, whichever the case may be, is priced in. This then helps them determine if the stock is placed for a bright or bleak future. One good indicator of expected earnings growth is the P/E ratio which determines the price the market is willing to pay for a stock based on its earnings prospects. So, you may want to check if NewFlex Technology is trading on a high P/E or a low P/E, relative to its industry.
Is NewFlex Technology Efficiently Re-investing Its Profits?
NewFlex Technology doesn't pay any regular dividends currently which essentially means that it has been reinvesting all of its profits into the business. This definitely contributes to the high earnings growth number that we discussed above.
Conclusion
In total, we are pretty happy with NewFlex Technology's performance. Particularly, we like that the company is reinvesting heavily into its business at a moderate rate of return. Unsurprisingly, this has led to an impressive earnings growth. If the company continues to grow its earnings the way it has, that could have a positive impact on its share price given how earnings per share influence long-term share prices. Not to forget, share price outcomes are also dependent on the potential risks a company may face. So it is important for investors to be aware of the risks involved in the business. You can see the 2 risks we have identified for NewFlex Technology by visiting our risks dashboard for free on our platform here.
Valuation is complex, but we're here to simplify it.
Discover if NewFlex Technology might be undervalued or overvalued with our detailed analysis, featuring fair value estimates, potential risks, dividends, insider trades, and its financial condition.
Access Free AnalysisHave feedback on this article? Concerned about the content? Get in touch with us directly. Alternatively, email editorial-team (at) simplywallst.com.
This article by Simply Wall St is general in nature. We provide commentary based on historical data and analyst forecasts only using an unbiased methodology and our articles are not intended to be financial advice. It does not constitute a recommendation to buy or sell any stock, and does not take account of your objectives, or your financial situation. We aim to bring you long-term focused analysis driven by fundamental data. Note that our analysis may not factor in the latest price-sensitive company announcements or qualitative material. Simply Wall St has no position in any stocks mentioned.
About KOSDAQ:A085670
NewFlex Technology
Engages in the manufacture and sale of flexible printed circuit boards products in South Korea.
Flawless balance sheet and slightly overvalued.
Market Insights

Advertisement
Community Narratives
The company that turned a verb into a global necessity and basically runs the modern internet, digital ads, smartphones, maps, and AI.
Fair Value US$300.00|7.5% undervalued
OS
Community Contributor
Flowers Foods Pays A Fair Price For Health
Fair Value US$16.12|25.4% undervalued
NV
Community Contributor
TMX Group will thrive with 33.3% profit margin and enduring market moat
Fair Value CA$49.90|3.6% overvalued
LI
Community Contributor
The "Molecular Pencil": Why Beam's Technology is Built to Win
Fair Value US$65.01|65.0% undervalued
DA
Community Contributor