
Advertisement
- South Korea
- /
- Communications
- /
- KOSDAQ:A081580
What Sungwoo Electronics Co., Ltd.'s (KOSDAQ:081580) 36% Share Price Gain Is Not Telling You
Sungwoo Electronics Co., Ltd. (KOSDAQ:081580) shareholders would be excited to see that the share price has had a great month, posting a 36% gain and recovering from prior weakness. The annual gain comes to 128% following the latest surge, making investors sit up and take notice.
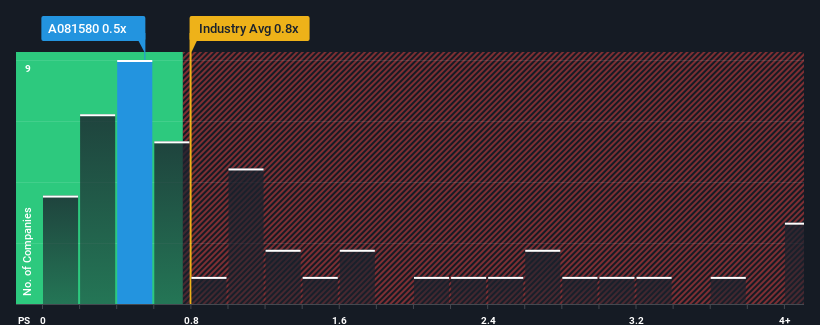
In spite of the firm bounce in price, you could still be forgiven for feeling indifferent about Sungwoo Electronics' P/S ratio of 0.5x, since the median price-to-sales (or "P/S") ratio for the Communications industry in Korea is also close to 0.8x. While this might not raise any eyebrows, if the P/S ratio is not justified investors could be missing out on a potential opportunity or ignoring looming disappointment.
Check out our latest analysis for Sungwoo Electronics
What Does Sungwoo Electronics' Recent Performance Look Like?
For example, consider that Sungwoo Electronics' financial performance has been poor lately as its revenue has been in decline. It might be that many expect the company to put the disappointing revenue performance behind them over the coming period, which has kept the P/S from falling. If not, then existing shareholders may be a little nervous about the viability of the share price.
We don't have analyst forecasts, but you can see how recent trends are setting up the company for the future by checking out our free report on Sungwoo Electronics' earnings, revenue and cash flow.Is There Some Revenue Growth Forecasted For Sungwoo Electronics?
In order to justify its P/S ratio, Sungwoo Electronics would need to produce growth that's similar to the industry.
In reviewing the last year of financials, we were disheartened to see the company's revenues fell to the tune of 12%. This has soured the latest three-year period, which nevertheless managed to deliver a decent 13% overall rise in revenue. Although it's been a bumpy ride, it's still fair to say the revenue growth recently has been mostly respectable for the company.
Comparing that to the industry, which is predicted to deliver 52% growth in the next 12 months, the company's momentum is weaker, based on recent medium-term annualised revenue results.
With this information, we find it interesting that Sungwoo Electronics is trading at a fairly similar P/S compared to the industry. It seems most investors are ignoring the fairly limited recent growth rates and are willing to pay up for exposure to the stock. They may be setting themselves up for future disappointment if the P/S falls to levels more in line with recent growth rates.
What We Can Learn From Sungwoo Electronics' P/S?
Sungwoo Electronics' stock has a lot of momentum behind it lately, which has brought its P/S level with the rest of the industry. Using the price-to-sales ratio alone to determine if you should sell your stock isn't sensible, however it can be a practical guide to the company's future prospects.
We've established that Sungwoo Electronics' average P/S is a bit surprising since its recent three-year growth is lower than the wider industry forecast. Right now we are uncomfortable with the P/S as this revenue performance isn't likely to support a more positive sentiment for long. Unless there is a significant improvement in the company's medium-term performance, it will be difficult to prevent the P/S ratio from declining to a more reasonable level.
And what about other risks? Every company has them, and we've spotted 1 warning sign for Sungwoo Electronics you should know about.
It's important to make sure you look for a great company, not just the first idea you come across. So if growing profitability aligns with your idea of a great company, take a peek at this free list of interesting companies with strong recent earnings growth (and a low P/E).
New: Manage All Your Stock Portfolios in One Place
We've created the ultimate portfolio companion for stock investors, and it's free.
• Connect an unlimited number of Portfolios and see your total in one currency
• Be alerted to new Warning Signs or Risks via email or mobile
• Track the Fair Value of your stocks
Have feedback on this article? Concerned about the content? Get in touch with us directly. Alternatively, email editorial-team (at) simplywallst.com.
This article by Simply Wall St is general in nature. We provide commentary based on historical data and analyst forecasts only using an unbiased methodology and our articles are not intended to be financial advice. It does not constitute a recommendation to buy or sell any stock, and does not take account of your objectives, or your financial situation. We aim to bring you long-term focused analysis driven by fundamental data. Note that our analysis may not factor in the latest price-sensitive company announcements or qualitative material. Simply Wall St has no position in any stocks mentioned.
About KOSDAQ:A081580
Sungwoo Electronics
Manufactures and sells broadcasting and wireless internet equipment worldwide.
Excellent balance sheet and fair value.
Market Insights

Advertisement
Community Narratives
MicroVision will explode future revenue by 380.37% with a vision towards success
Fair Value US$60.00|98.5% undervalued
TH
Community Contributor
The Indispensable Artery for a New North American Economy
Fair Value CA$132.87|2.3% undervalued
TI
Community Contributor