
Advertisement
- South Korea
- /
- Electronic Equipment and Components
- /
- KOSDAQ:A036710
Simmtech Holdings Co., Ltd.'s (KOSDAQ:036710) Price Is Right But Growth Is Lacking After Shares Rocket 79%
Simmtech Holdings Co., Ltd. (KOSDAQ:036710) shareholders have had their patience rewarded with a 79% share price jump in the last month. Looking back a bit further, it's encouraging to see the stock is up 58% in the last year.
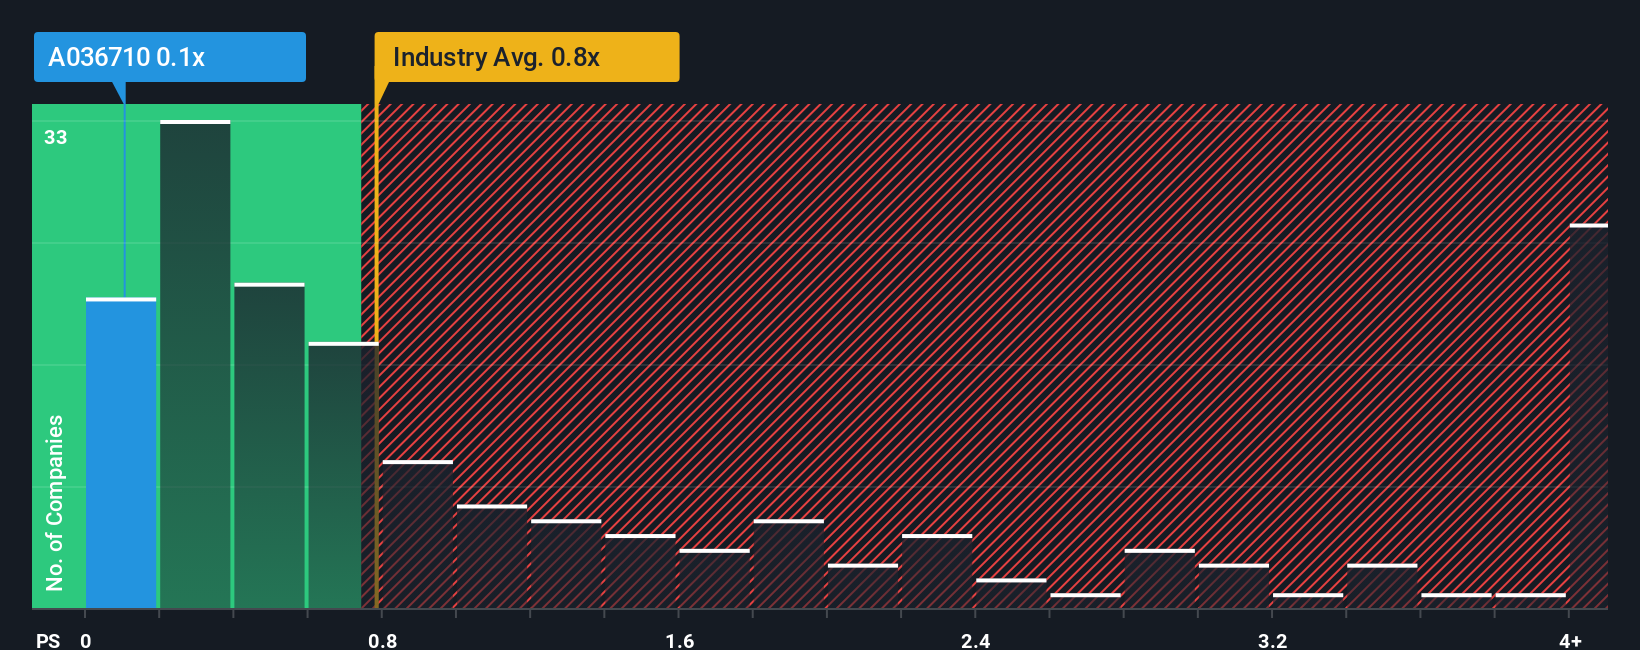
Although its price has surged higher, Simmtech Holdings may still be sending buy signals at present with its price-to-sales (or "P/S") ratio of 0.1x, considering almost half of all companies in the Electronic industry in Korea have P/S ratios greater than 0.8x and even P/S higher than 3x aren't out of the ordinary. However, the P/S might be low for a reason and it requires further investigation to determine if it's justified.
See our latest analysis for Simmtech Holdings
How Has Simmtech Holdings Performed Recently?
Revenue has risen firmly for Simmtech Holdings recently, which is pleasing to see. It might be that many expect the respectable revenue performance to degrade substantially, which has repressed the P/S. If that doesn't eventuate, then existing shareholders have reason to be optimistic about the future direction of the share price.
Want the full picture on earnings, revenue and cash flow for the company? Then our free report on Simmtech Holdings will help you shine a light on its historical performance.Is There Any Revenue Growth Forecasted For Simmtech Holdings?
Simmtech Holdings' P/S ratio would be typical for a company that's only expected to deliver limited growth, and importantly, perform worse than the industry.
Retrospectively, the last year delivered a decent 12% gain to the company's revenues. Ultimately though, it couldn't turn around the poor performance of the prior period, with revenue shrinking 17% in total over the last three years. So unfortunately, we have to acknowledge that the company has not done a great job of growing revenue over that time.
Weighing that medium-term revenue trajectory against the broader industry's one-year forecast for expansion of 15% shows it's an unpleasant look.
In light of this, it's understandable that Simmtech Holdings' P/S would sit below the majority of other companies. Nonetheless, there's no guarantee the P/S has reached a floor yet with revenue going in reverse. Even just maintaining these prices could be difficult to achieve as recent revenue trends are already weighing down the shares.
What Does Simmtech Holdings' P/S Mean For Investors?
The latest share price surge wasn't enough to lift Simmtech Holdings' P/S close to the industry median. Typically, we'd caution against reading too much into price-to-sales ratios when settling on investment decisions, though it can reveal plenty about what other market participants think about the company.
Our examination of Simmtech Holdings confirms that the company's shrinking revenue over the past medium-term is a key factor in its low price-to-sales ratio, given the industry is projected to grow. At this stage investors feel the potential for an improvement in revenue isn't great enough to justify a higher P/S ratio. Given the current circumstances, it seems unlikely that the share price will experience any significant movement in either direction in the near future if recent medium-term revenue trends persist.
It's always necessary to consider the ever-present spectre of investment risk. We've identified 4 warning signs with Simmtech Holdings (at least 2 which are a bit concerning), and understanding them should be part of your investment process.
Of course, profitable companies with a history of great earnings growth are generally safer bets. So you may wish to see this free collection of other companies that have reasonable P/E ratios and have grown earnings strongly.
New: Manage All Your Stock Portfolios in One Place
We've created the ultimate portfolio companion for stock investors, and it's free.
• Connect an unlimited number of Portfolios and see your total in one currency
• Be alerted to new Warning Signs or Risks via email or mobile
• Track the Fair Value of your stocks
Have feedback on this article? Concerned about the content? Get in touch with us directly. Alternatively, email editorial-team (at) simplywallst.com.
This article by Simply Wall St is general in nature. We provide commentary based on historical data and analyst forecasts only using an unbiased methodology and our articles are not intended to be financial advice. It does not constitute a recommendation to buy or sell any stock, and does not take account of your objectives, or your financial situation. We aim to bring you long-term focused analysis driven by fundamental data. Note that our analysis may not factor in the latest price-sensitive company announcements or qualitative material. Simply Wall St has no position in any stocks mentioned.
About KOSDAQ:A036710
Simmtech Holdings
Through its subsidiaries, develops, manufactures, and sells printed circuit boards (PCBs) for semiconductors worldwide.
Low risk and slightly overvalued.
Market Insights

Advertisement
Community Narratives
MicroVision will explode future revenue by 380.37% with a vision towards success
Fair Value US$60.00|98.5% undervalued
TH
Community Contributor
The Indispensable Artery for a New North American Economy
Fair Value CA$132.87|2.3% undervalued
TI
Community Contributor