
Advertisement
Warren Buffett famously said, 'Volatility is far from synonymous with risk.' It's only natural to consider a company's balance sheet when you examine how risky it is, since debt is often involved when a business collapses. We can see that Bluecom Co., Ltd. (KOSDAQ:033560) does use debt in its business. But is this debt a concern to shareholders?
When Is Debt A Problem?
Debt is a tool to help businesses grow, but if a business is incapable of paying off its lenders, then it exists at their mercy. Ultimately, if the company can't fulfill its legal obligations to repay debt, shareholders could walk away with nothing. However, a more usual (but still expensive) situation is where a company must dilute shareholders at a cheap share price simply to get debt under control. Of course, the upside of debt is that it often represents cheap capital, especially when it replaces dilution in a company with the ability to reinvest at high rates of return. The first step when considering a company's debt levels is to consider its cash and debt together.
See our latest analysis for Bluecom
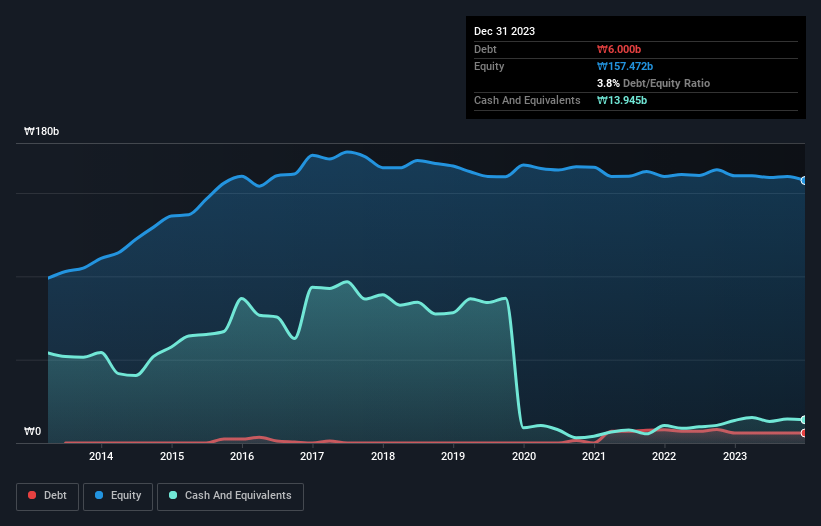
What Is Bluecom's Net Debt?
As you can see below, Bluecom had ₩6.00b of debt, at December 2023, which is about the same as the year before. You can click the chart for greater detail. But on the other hand it also has ₩13.9b in cash, leading to a ₩7.94b net cash position.
How Strong Is Bluecom's Balance Sheet?
We can see from the most recent balance sheet that Bluecom had liabilities of ₩12.5b falling due within a year, and liabilities of ₩4.50b due beyond that. Offsetting these obligations, it had cash of ₩13.9b as well as receivables valued at ₩4.46b due within 12 months. So it actually has ₩1.42b more liquid assets than total liabilities.
This short term liquidity is a sign that Bluecom could probably pay off its debt with ease, as its balance sheet is far from stretched. Succinctly put, Bluecom boasts net cash, so it's fair to say it does not have a heavy debt load! There's no doubt that we learn most about debt from the balance sheet. But you can't view debt in total isolation; since Bluecom will need earnings to service that debt. So if you're keen to discover more about its earnings, it might be worth checking out this graph of its long term earnings trend.
Over 12 months, Bluecom made a loss at the EBIT level, and saw its revenue drop to ₩33b, which is a fall of 44%. To be frank that doesn't bode well.
So How Risky Is Bluecom?
We have no doubt that loss making companies are, in general, riskier than profitable ones. And we do note that Bluecom had an earnings before interest and tax (EBIT) loss, over the last year. And over the same period it saw negative free cash outflow of ₩3.1b and booked a ₩2.7b accounting loss. But the saving grace is the ₩7.94b on the balance sheet. That means it could keep spending at its current rate for more than two years. Overall, its balance sheet doesn't seem overly risky, at the moment, but we're always cautious until we see the positive free cash flow. The balance sheet is clearly the area to focus on when you are analysing debt. However, not all investment risk resides within the balance sheet - far from it. For example Bluecom has 2 warning signs (and 1 which is a bit concerning) we think you should know about.
At the end of the day, it's often better to focus on companies that are free from net debt. You can access our special list of such companies (all with a track record of profit growth). It's free.
Valuation is complex, but we're here to simplify it.
Discover if Bluecom might be undervalued or overvalued with our detailed analysis, featuring fair value estimates, potential risks, dividends, insider trades, and its financial condition.
Access Free AnalysisHave feedback on this article? Concerned about the content? Get in touch with us directly. Alternatively, email editorial-team (at) simplywallst.com.
This article by Simply Wall St is general in nature. We provide commentary based on historical data and analyst forecasts only using an unbiased methodology and our articles are not intended to be financial advice. It does not constitute a recommendation to buy or sell any stock, and does not take account of your objectives, or your financial situation. We aim to bring you long-term focused analysis driven by fundamental data. Note that our analysis may not factor in the latest price-sensitive company announcements or qualitative material. Simply Wall St has no position in any stocks mentioned.
About KOSDAQ:A033560
Bluecom
Operates as a wireless technology company in South Korea and internationally.
Slightly overvalued with questionable track record.
Market Insights

Advertisement
Community Narratives
The company that turned a verb into a global necessity and basically runs the modern internet, digital ads, smartphones, maps, and AI.
Fair Value US$300.00|5.2% undervalued
OS
Community Contributor
Flowers Foods Pays A Fair Price For Health
Fair Value US$16.12|24.9% undervalued
NV
Community Contributor
TMX Group will thrive with 33.3% profit margin and enduring market moat
Fair Value CA$49.90|3.3% overvalued
LI
Community Contributor
The "Molecular Pencil": Why Beam's Technology is Built to Win
Fair Value US$65.01|64.5% undervalued
DA
Community Contributor