
Advertisement
- South Korea
- /
- Electronic Equipment and Components
- /
- KOSDAQ:A032820
Is Woori Technology (KOSDAQ:032820) A Risky Investment?
David Iben put it well when he said, 'Volatility is not a risk we care about. What we care about is avoiding the permanent loss of capital.' It's only natural to consider a company's balance sheet when you examine how risky it is, since debt is often involved when a business collapses. As with many other companies Woori Technology, Inc. (KOSDAQ:032820) makes use of debt. But the real question is whether this debt is making the company risky.
We check all companies for important risks. See what we found for Woori Technology in our free report.When Is Debt Dangerous?
Debt assists a business until the business has trouble paying it off, either with new capital or with free cash flow. If things get really bad, the lenders can take control of the business. While that is not too common, we often do see indebted companies permanently diluting shareholders because lenders force them to raise capital at a distressed price. Having said that, the most common situation is where a company manages its debt reasonably well - and to its own advantage. The first thing to do when considering how much debt a business uses is to look at its cash and debt together.
How Much Debt Does Woori Technology Carry?
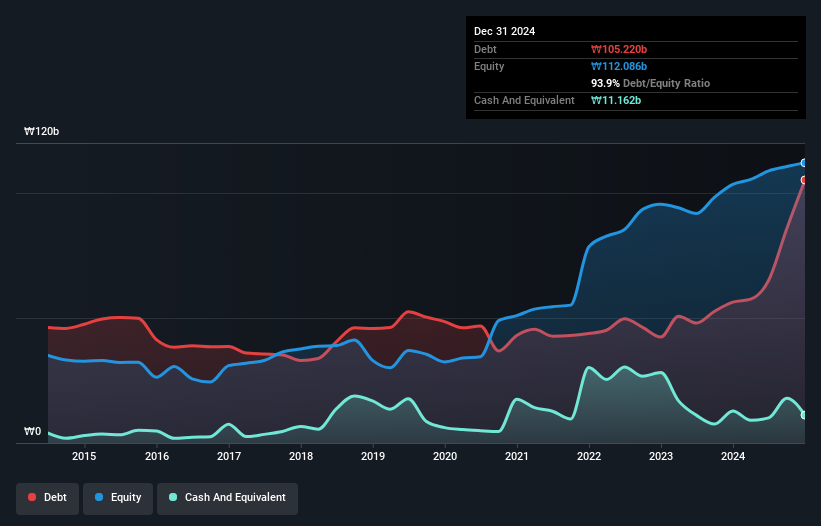
The image below, which you can click on for greater detail, shows that at December 2024 Woori Technology had debt of ₩105.2b, up from ₩56.3b in one year. However, it does have ₩11.2b in cash offsetting this, leading to net debt of about ₩94.1b.
A Look At Woori Technology's Liabilities
According to the last reported balance sheet, Woori Technology had liabilities of ₩73.3b due within 12 months, and liabilities of ₩80.1b due beyond 12 months. On the other hand, it had cash of ₩11.2b and ₩25.5b worth of receivables due within a year. So it has liabilities totalling ₩116.7b more than its cash and near-term receivables, combined.
While this might seem like a lot, it is not so bad since Woori Technology has a market capitalization of ₩339.2b, and so it could probably strengthen its balance sheet by raising capital if it needed to. However, it is still worthwhile taking a close look at its ability to pay off debt. When analysing debt levels, the balance sheet is the obvious place to start. But you can't view debt in total isolation; since Woori Technology will need earnings to service that debt. So if you're keen to discover more about its earnings, it might be worth checking out this graph of its long term earnings trend.
See our latest analysis for Woori Technology
In the last year Woori Technology wasn't profitable at an EBIT level, but managed to grow its revenue by 13%, to ₩71b. We usually like to see faster growth from unprofitable companies, but each to their own.
Caveat Emptor
Over the last twelve months Woori Technology produced an earnings before interest and tax (EBIT) loss. To be specific the EBIT loss came in at ₩598m. Considering that alongside the liabilities mentioned above does not give us much confidence that company should be using so much debt. So we think its balance sheet is a little strained, though not beyond repair. However, it doesn't help that it burned through ₩37b of cash over the last year. So in short it's a really risky stock. When we look at a riskier company, we like to check how their profits (or losses) are trending over time. Today, we're providing readers this interactive graph showing how Woori Technology's profit, revenue, and operating cashflow have changed over the last few years.
When all is said and done, sometimes its easier to focus on companies that don't even need debt. Readers can access a list of growth stocks with zero net debt 100% free, right now.
Valuation is complex, but we're here to simplify it.
Discover if Woori Technology might be undervalued or overvalued with our detailed analysis, featuring fair value estimates, potential risks, dividends, insider trades, and its financial condition.
Access Free AnalysisHave feedback on this article? Concerned about the content? Get in touch with us directly. Alternatively, email editorial-team (at) simplywallst.com.
This article by Simply Wall St is general in nature. We provide commentary based on historical data and analyst forecasts only using an unbiased methodology and our articles are not intended to be financial advice. It does not constitute a recommendation to buy or sell any stock, and does not take account of your objectives, or your financial situation. We aim to bring you long-term focused analysis driven by fundamental data. Note that our analysis may not factor in the latest price-sensitive company announcements or qualitative material. Simply Wall St has no position in any stocks mentioned.
About KOSDAQ:A032820
Woori Technology
Manufactures and sells switchboard and electric control panels.
Proven track record with low risk.
Market Insights

Advertisement
Community Narratives
MicroVision will explode future revenue by 380.37% with a vision towards success
Fair Value US$60.00|98.4% undervalued
TH
Community Contributor
The Indispensable Artery for a New North American Economy
Fair Value CA$132.87|1.3% undervalued
TI
Community Contributor