
Advertisement
- South Korea
- /
- Software
- /
- KOSDAQ:A431190
We Think K3I.Co.Ltd (KOSDAQ:431190) Can Afford To Drive Business Growth
Just because a business does not make any money, does not mean that the stock will go down. For example, although software-as-a-service business Salesforce.com lost money for years while it grew recurring revenue, if you held shares since 2005, you'd have done very well indeed. Having said that, unprofitable companies are risky because they could potentially burn through all their cash and become distressed.
So, the natural question for K3I.Co.Ltd (KOSDAQ:431190) shareholders is whether they should be concerned by its rate of cash burn. For the purpose of this article, we'll define cash burn as the amount of cash the company is spending each year to fund its growth (also called its negative free cash flow). We'll start by comparing its cash burn with its cash reserves in order to calculate its cash runway.
Our free stock report includes 2 warning signs investors should be aware of before investing in K3I.Co.Ltd. Read for free now.When Might K3I.Co.Ltd Run Out Of Money?
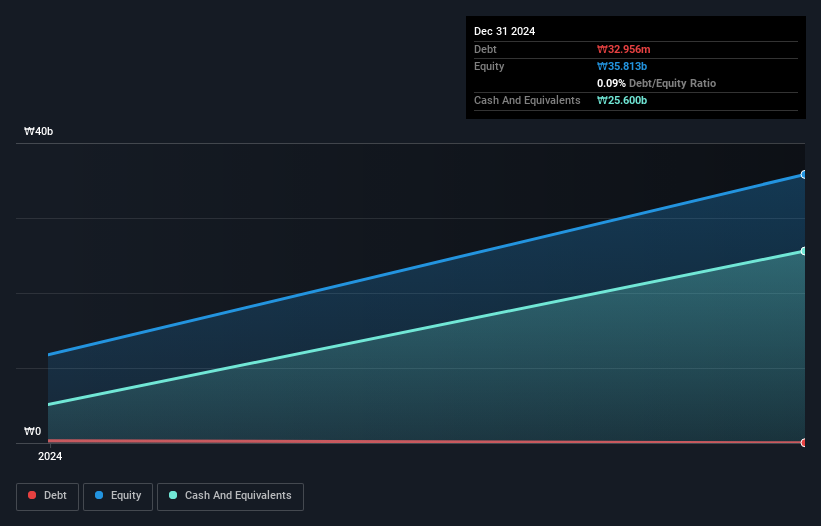
You can calculate a company's cash runway by dividing the amount of cash it has by the rate at which it is spending that cash. As at December 2024, K3I.Co.Ltd had cash of ₩26b and such minimal debt that we can ignore it for the purposes of this analysis. In the last year, its cash burn was ₩3.3b. Therefore, from December 2024 it had 7.8 years of cash runway. Even though this is but one measure of the company's cash burn, the thought of such a long cash runway warms our bellies in a comforting way. You can see how its cash balance has changed over time in the image below.
Check out our latest analysis for K3I.Co.Ltd
How Well Is K3I.Co.Ltd Growing?
K3I.Co.Ltd boosted investment sharply in the last year, with cash burn ramping by 87%. That does give us pause, and we can't take much solace in the operating revenue growth of 6.5% in the same time frame. Considering both these metrics, we're a little concerned about how the company is developing. In reality, this article only makes a short study of the company's growth data. This graph of historic earnings and revenue shows how K3I.Co.Ltd is building its business over time.
How Hard Would It Be For K3I.Co.Ltd To Raise More Cash For Growth?
Even though it seems like K3I.Co.Ltd is developing its business nicely, we still like to consider how easily it could raise more money to accelerate growth. Issuing new shares, or taking on debt, are the most common ways for a listed company to raise more money for its business. Commonly, a business will sell new shares in itself to raise cash and drive growth. We can compare a company's cash burn to its market capitalisation to get a sense for how many new shares a company would have to issue to fund one year's operations.
K3I.Co.Ltd's cash burn of ₩3.3b is about 10% of its ₩33b market capitalisation. As a result, we'd venture that the company could raise more cash for growth without much trouble, albeit at the cost of some dilution.
So, Should We Worry About K3I.Co.Ltd's Cash Burn?
On this analysis of K3I.Co.Ltd's cash burn, we think its cash runway was reassuring, while its increasing cash burn has us a bit worried. Based on the factors mentioned in this article, we think its cash burn situation warrants some attention from shareholders, but we don't think they should be worried. Its important for readers to be cognizant of the risks that can affect the company's operations, and we've picked out 2 warning signs for K3I.Co.Ltd that investors should know when investing in the stock.
If you would prefer to check out another company with better fundamentals, then do not miss this free list of interesting companies, that have HIGH return on equity and low debt or this list of stocks which are all forecast to grow.
Valuation is complex, but we're here to simplify it.
Discover if K3I.Co.Ltd might be undervalued or overvalued with our detailed analysis, featuring fair value estimates, potential risks, dividends, insider trades, and its financial condition.
Access Free AnalysisHave feedback on this article? Concerned about the content? Get in touch with us directly. Alternatively, email editorial-team (at) simplywallst.com.
This article by Simply Wall St is general in nature. We provide commentary based on historical data and analyst forecasts only using an unbiased methodology and our articles are not intended to be financial advice. It does not constitute a recommendation to buy or sell any stock, and does not take account of your objectives, or your financial situation. We aim to bring you long-term focused analysis driven by fundamental data. Note that our analysis may not factor in the latest price-sensitive company announcements or qualitative material. Simply Wall St has no position in any stocks mentioned.
About KOSDAQ:A431190
K3I.Co.Ltd
Engages in the research and development of virtual reality and augmented reality source technology in South Korea.
Excellent balance sheet with very low risk.
Market Insights

Advertisement
Community Narratives
MicroVision will explode future revenue by 380.37% with a vision towards success
Fair Value US$60.00|98.5% undervalued
TH
Community Contributor
The Indispensable Artery for a New North American Economy
Fair Value CA$132.87|2.3% undervalued
TI
Community Contributor