
Advertisement
Legendary fund manager Li Lu (who Charlie Munger backed) once said, 'The biggest investment risk is not the volatility of prices, but whether you will suffer a permanent loss of capital.' When we think about how risky a company is, we always like to look at its use of debt, since debt overload can lead to ruin. We note that Kec Corporation (KRX:092220) does have debt on its balance sheet. But should shareholders be worried about its use of debt?
Why Does Debt Bring Risk?
Debt is a tool to help businesses grow, but if a business is incapable of paying off its lenders, then it exists at their mercy. Part and parcel of capitalism is the process of 'creative destruction' where failed businesses are mercilessly liquidated by their bankers. However, a more common (but still painful) scenario is that it has to raise new equity capital at a low price, thus permanently diluting shareholders. Of course, the upside of debt is that it often represents cheap capital, especially when it replaces dilution in a company with the ability to reinvest at high rates of return. The first step when considering a company's debt levels is to consider its cash and debt together.
See our latest analysis for Kec
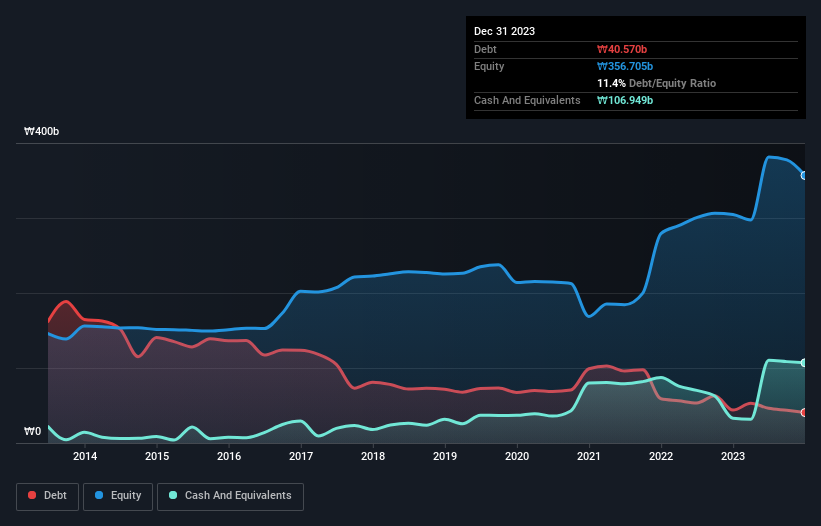
What Is Kec's Net Debt?
You can click the graphic below for the historical numbers, but it shows that Kec had ₩40.6b of debt in December 2023, down from ₩43.8b, one year before. But on the other hand it also has ₩106.9b in cash, leading to a ₩66.4b net cash position.
A Look At Kec's Liabilities
Zooming in on the latest balance sheet data, we can see that Kec had liabilities of ₩68.9b due within 12 months and liabilities of ₩22.2b due beyond that. Offsetting these obligations, it had cash of ₩106.9b as well as receivables valued at ₩31.3b due within 12 months. So it actually has ₩47.3b more liquid assets than total liabilities.
This excess liquidity suggests that Kec is taking a careful approach to debt. Given it has easily adequate short term liquidity, we don't think it will have any issues with its lenders. Simply put, the fact that Kec has more cash than debt is arguably a good indication that it can manage its debt safely. There's no doubt that we learn most about debt from the balance sheet. But it is Kec's earnings that will influence how the balance sheet holds up in the future. So when considering debt, it's definitely worth looking at the earnings trend. Click here for an interactive snapshot.
In the last year Kec had a loss before interest and tax, and actually shrunk its revenue by 19%, to ₩207b. That's not what we would hope to see.
So How Risky Is Kec?
We have no doubt that loss making companies are, in general, riskier than profitable ones. And the fact is that over the last twelve months Kec lost money at the earnings before interest and tax (EBIT) line. And over the same period it saw negative free cash outflow of ₩11b and booked a ₩38b accounting loss. With only ₩66.4b on the balance sheet, it would appear that its going to need to raise capital again soon. Even though its balance sheet seems sufficiently liquid, debt always makes us a little nervous if a company doesn't produce free cash flow regularly. When analysing debt levels, the balance sheet is the obvious place to start. But ultimately, every company can contain risks that exist outside of the balance sheet. Be aware that Kec is showing 2 warning signs in our investment analysis , and 1 of those is a bit concerning...
If you're interested in investing in businesses that can grow profits without the burden of debt, then check out this free list of growing businesses that have net cash on the balance sheet.
Valuation is complex, but we're here to simplify it.
Discover if Kec might be undervalued or overvalued with our detailed analysis, featuring fair value estimates, potential risks, dividends, insider trades, and its financial condition.
Access Free AnalysisHave feedback on this article? Concerned about the content? Get in touch with us directly. Alternatively, email editorial-team (at) simplywallst.com.
This article by Simply Wall St is general in nature. We provide commentary based on historical data and analyst forecasts only using an unbiased methodology and our articles are not intended to be financial advice. It does not constitute a recommendation to buy or sell any stock, and does not take account of your objectives, or your financial situation. We aim to bring you long-term focused analysis driven by fundamental data. Note that our analysis may not factor in the latest price-sensitive company announcements or qualitative material. Simply Wall St has no position in any stocks mentioned.
About KOSE:A092220
Kec
Engages in the manufacture and sale of non-memory semiconductors in South Korea, China, Japan, and the United States.
Flawless balance sheet and good value.
Similar Companies
Market Insights

Advertisement
Community Narratives
MicroVision will explode future revenue by 380.37% with a vision towards success
Fair Value US$60.00|98.4% undervalued
TH
Community Contributor
The Indispensable Artery for a New North American Economy
Fair Value CA$132.87|1.3% undervalued
TI
Community Contributor