
Advertisement
- South Korea
- /
- Semiconductors
- /
- KOSDAQ:A306620
Here's Why NeontechLtd (KOSDAQ:306620) Can Manage Its Debt Responsibly
David Iben put it well when he said, 'Volatility is not a risk we care about. What we care about is avoiding the permanent loss of capital.' So it might be obvious that you need to consider debt, when you think about how risky any given stock is, because too much debt can sink a company. We can see that Neontech Co.,Ltd. (KOSDAQ:306620) does use debt in its business. But the real question is whether this debt is making the company risky.
When Is Debt Dangerous?
Debt assists a business until the business has trouble paying it off, either with new capital or with free cash flow. If things get really bad, the lenders can take control of the business. However, a more frequent (but still costly) occurrence is where a company must issue shares at bargain-basement prices, permanently diluting shareholders, just to shore up its balance sheet. Of course, plenty of companies use debt to fund growth, without any negative consequences. The first thing to do when considering how much debt a business uses is to look at its cash and debt together.
View our latest analysis for NeontechLtd
What Is NeontechLtd's Net Debt?
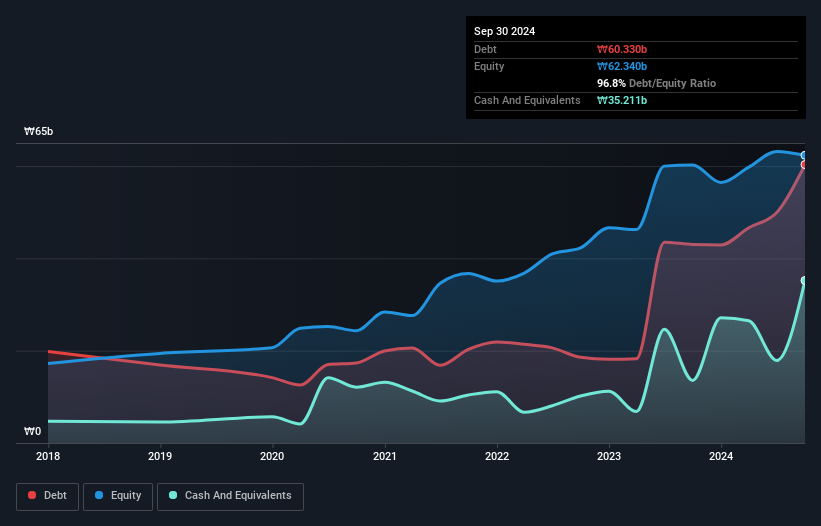
You can click the graphic below for the historical numbers, but it shows that as of September 2024 NeontechLtd had ₩60.3b of debt, an increase on ₩43.0b, over one year. However, it does have ₩35.2b in cash offsetting this, leading to net debt of about ₩25.1b.
A Look At NeontechLtd's Liabilities
The latest balance sheet data shows that NeontechLtd had liabilities of ₩72.7b due within a year, and liabilities of ₩17.7b falling due after that. On the other hand, it had cash of ₩35.2b and ₩17.5b worth of receivables due within a year. So it has liabilities totalling ₩37.8b more than its cash and near-term receivables, combined.
While this might seem like a lot, it is not so bad since NeontechLtd has a market capitalization of ₩120.0b, and so it could probably strengthen its balance sheet by raising capital if it needed to. But we definitely want to keep our eyes open to indications that its debt is bringing too much risk.
We measure a company's debt load relative to its earnings power by looking at its net debt divided by its earnings before interest, tax, depreciation, and amortization (EBITDA) and by calculating how easily its earnings before interest and tax (EBIT) cover its interest expense (interest cover). The advantage of this approach is that we take into account both the absolute quantum of debt (with net debt to EBITDA) and the actual interest expenses associated with that debt (with its interest cover ratio).
While NeontechLtd's debt to EBITDA ratio (3.1) suggests that it uses some debt, its interest cover is very weak, at 1.8, suggesting high leverage. It seems clear that the cost of borrowing money is negatively impacting returns for shareholders, of late. One redeeming factor for NeontechLtd is that it turned last year's EBIT loss into a gain of ₩6.2b, over the last twelve months. There's no doubt that we learn most about debt from the balance sheet. But it is NeontechLtd's earnings that will influence how the balance sheet holds up in the future. So if you're keen to discover more about its earnings, it might be worth checking out this graph of its long term earnings trend.
But our final consideration is also important, because a company cannot pay debt with paper profits; it needs cold hard cash. So it's worth checking how much of the earnings before interest and tax (EBIT) is backed by free cash flow. Happily for any shareholders, NeontechLtd actually produced more free cash flow than EBIT over the last year. That sort of strong cash conversion gets us as excited as the crowd when the beat drops at a Daft Punk concert.
Our View
On our analysis NeontechLtd's conversion of EBIT to free cash flow should signal that it won't have too much trouble with its debt. However, our other observations weren't so heartening. In particular, interest cover gives us cold feet. When we consider all the factors mentioned above, we do feel a bit cautious about NeontechLtd's use of debt. While we appreciate debt can enhance returns on equity, we'd suggest that shareholders keep close watch on its debt levels, lest they increase. There's no doubt that we learn most about debt from the balance sheet. However, not all investment risk resides within the balance sheet - far from it. For example, we've discovered 3 warning signs for NeontechLtd (1 is concerning!) that you should be aware of before investing here.
When all is said and done, sometimes its easier to focus on companies that don't even need debt. Readers can access a list of growth stocks with zero net debt 100% free, right now.
Valuation is complex, but we're here to simplify it.
Discover if NeontechLtd might be undervalued or overvalued with our detailed analysis, featuring fair value estimates, potential risks, dividends, insider trades, and its financial condition.
Access Free AnalysisHave feedback on this article? Concerned about the content? Get in touch with us directly. Alternatively, email editorial-team (at) simplywallst.com.
This article by Simply Wall St is general in nature. We provide commentary based on historical data and analyst forecasts only using an unbiased methodology and our articles are not intended to be financial advice. It does not constitute a recommendation to buy or sell any stock, and does not take account of your objectives, or your financial situation. We aim to bring you long-term focused analysis driven by fundamental data. Note that our analysis may not factor in the latest price-sensitive company announcements or qualitative material. Simply Wall St has no position in any stocks mentioned.
About KOSDAQ:A306620
NeontechLtd
Manufactures and sells mechanical dicing and system automation equipment in South Korea and internationally.
Adequate balance sheet and fair value.
Market Insights

Advertisement
Community Narratives
MicroVision will explode future revenue by 380.37% with a vision towards success
Fair Value US$60.00|98.4% undervalued
TH
Community Contributor
The Indispensable Artery for a New North American Economy
Fair Value CA$132.87|1.3% undervalued
TI
Community Contributor