- South Korea
- /
- Semiconductors
- /
- KOSDAQ:A222800
Even though SIMMTECH (KOSDAQ:222800) has lost ₩82b market cap in last 7 days, shareholders are still up 205% over 5 years


The last three months have been tough on SIMMTECH Co., Ltd. (KOSDAQ:222800) shareholders, who have seen the share price decline a rather worrying 41%. But that doesn't change the fact that shareholders have received really good returns over the last five years. In fact, the share price is 174% higher today. Generally speaking the long term returns will give you a better idea of business quality than short periods can. Ultimately business performance will determine whether the stock price continues the positive long term trend.
In light of the stock dropping 12% in the past week, we want to investigate the longer term story, and see if fundamentals have been the driver of the company's positive five-year return.
View our latest analysis for SIMMTECH
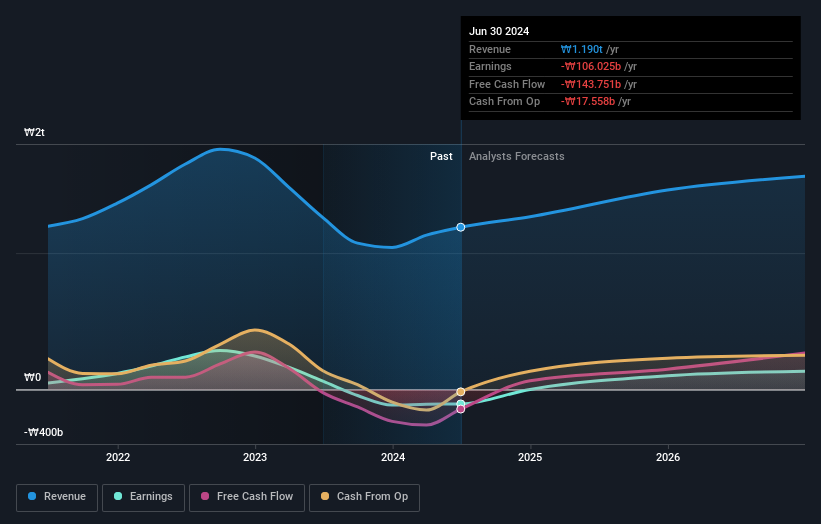
SIMMTECH wasn't profitable in the last twelve months, it is unlikely we'll see a strong correlation between its share price and its earnings per share (EPS). Arguably revenue is our next best option. When a company doesn't make profits, we'd generally hope to see good revenue growth. Some companies are willing to postpone profitability to grow revenue faster, but in that case one would hope for good top-line growth to make up for the lack of earnings.
For the last half decade, SIMMTECH can boast revenue growth at a rate of 4.5% per year. That's not a very high growth rate considering the bottom line. In comparison, the share price rise of 22% per year over the last half a decade is pretty impressive. While we wouldn't be overly concerned, it might be worth checking whether you think the fundamental business gains really justify the share price action. Some might suggest that the sentiment around the stock is rather positive.
You can see below how earnings and revenue have changed over time (discover the exact values by clicking on the image).
This free interactive report on SIMMTECH's balance sheet strength is a great place to start, if you want to investigate the stock further.
What About Dividends?
It is important to consider the total shareholder return, as well as the share price return, for any given stock. The TSR is a return calculation that accounts for the value of cash dividends (assuming that any dividend received was reinvested) and the calculated value of any discounted capital raisings and spin-offs. It's fair to say that the TSR gives a more complete picture for stocks that pay a dividend. As it happens, SIMMTECH's TSR for the last 5 years was 205%, which exceeds the share price return mentioned earlier. The dividends paid by the company have thusly boosted the total shareholder return.
A Different Perspective
SIMMTECH shareholders are down 49% for the year (even including dividends), but the market itself is up 1.8%. Even the share prices of good stocks drop sometimes, but we want to see improvements in the fundamental metrics of a business, before getting too interested. Longer term investors wouldn't be so upset, since they would have made 25%, each year, over five years. If the fundamental data continues to indicate long term sustainable growth, the current sell-off could be an opportunity worth considering. It's always interesting to track share price performance over the longer term. But to understand SIMMTECH better, we need to consider many other factors. Consider risks, for instance. Every company has them, and we've spotted 1 warning sign for SIMMTECH you should know about.
We will like SIMMTECH better if we see some big insider buys. While we wait, check out this free list of undervalued stocks (mostly small caps) with considerable, recent, insider buying.
Please note, the market returns quoted in this article reflect the market weighted average returns of stocks that currently trade on South Korean exchanges.
New: Manage All Your Stock Portfolios in One Place
We've created the ultimate portfolio companion for stock investors, and it's free.
• Connect an unlimited number of Portfolios and see your total in one currency
• Be alerted to new Warning Signs or Risks via email or mobile
• Track the Fair Value of your stocks
Have feedback on this article? Concerned about the content? Get in touch with us directly. Alternatively, email editorial-team (at) simplywallst.com.
This article by Simply Wall St is general in nature. We provide commentary based on historical data and analyst forecasts only using an unbiased methodology and our articles are not intended to be financial advice. It does not constitute a recommendation to buy or sell any stock, and does not take account of your objectives, or your financial situation. We aim to bring you long-term focused analysis driven by fundamental data. Note that our analysis may not factor in the latest price-sensitive company announcements or qualitative material. Simply Wall St has no position in any stocks mentioned.
About KOSDAQ:A222800
SIMMTECH
Engages in the developing and manufacturing of high-layer printed circuit boards (PCBs) for semiconductors and mobile devices worldwide.
Undervalued with moderate growth potential.

