
Advertisement
- South Korea
- /
- Semiconductors
- /
- KOSDAQ:A200470
APACT Co., Ltd.'s (KOSDAQ:200470) 28% Price Boost Is Out Of Tune With Revenues
Despite an already strong run, APACT Co., Ltd. (KOSDAQ:200470) shares have been powering on, with a gain of 28% in the last thirty days. Looking back a bit further, it's encouraging to see the stock is up 28% in the last year.
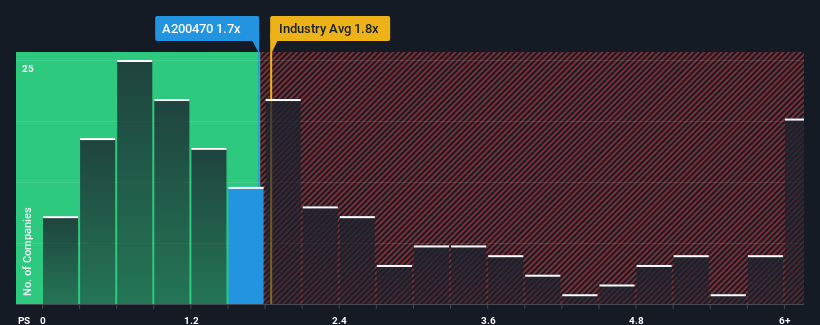
Although its price has surged higher, it's still not a stretch to say that APACT's price-to-sales (or "P/S") ratio of 1.7x right now seems quite "middle-of-the-road" compared to the Semiconductor industry in Korea, where the median P/S ratio is around 1.8x. While this might not raise any eyebrows, if the P/S ratio is not justified investors could be missing out on a potential opportunity or ignoring looming disappointment.
See our latest analysis for APACT
What Does APACT's Recent Performance Look Like?
With revenue growth that's exceedingly strong of late, APACT has been doing very well. Perhaps the market is expecting future revenue performance to taper off, which has kept the P/S from rising. If you like the company, you'd be hoping this isn't the case so that you could potentially pick up some stock while it's not quite in favour.
We don't have analyst forecasts, but you can see how recent trends are setting up the company for the future by checking out our free report on APACT's earnings, revenue and cash flow.What Are Revenue Growth Metrics Telling Us About The P/S?
There's an inherent assumption that a company should be matching the industry for P/S ratios like APACT's to be considered reasonable.
Retrospectively, the last year delivered an exceptional 124% gain to the company's top line. The latest three year period has also seen an excellent 122% overall rise in revenue, aided by its short-term performance. So we can start by confirming that the company has done a great job of growing revenue over that time.
Comparing the recent medium-term revenue trends against the industry's one-year growth forecast of 66% shows it's noticeably less attractive.
With this in mind, we find it intriguing that APACT's P/S is comparable to that of its industry peers. It seems most investors are ignoring the fairly limited recent growth rates and are willing to pay up for exposure to the stock. Maintaining these prices will be difficult to achieve as a continuation of recent revenue trends is likely to weigh down the shares eventually.
The Final Word
APACT appears to be back in favour with a solid price jump bringing its P/S back in line with other companies in the industry While the price-to-sales ratio shouldn't be the defining factor in whether you buy a stock or not, it's quite a capable barometer of revenue expectations.
We've established that APACT's average P/S is a bit surprising since its recent three-year growth is lower than the wider industry forecast. Right now we are uncomfortable with the P/S as this revenue performance isn't likely to support a more positive sentiment for long. Unless there is a significant improvement in the company's medium-term performance, it will be difficult to prevent the P/S ratio from declining to a more reasonable level.
There are also other vital risk factors to consider before investing and we've discovered 3 warning signs for APACT that you should be aware of.
If these risks are making you reconsider your opinion on APACT, explore our interactive list of high quality stocks to get an idea of what else is out there.
New: Manage All Your Stock Portfolios in One Place
We've created the ultimate portfolio companion for stock investors, and it's free.
• Connect an unlimited number of Portfolios and see your total in one currency
• Be alerted to new Warning Signs or Risks via email or mobile
• Track the Fair Value of your stocks
Have feedback on this article? Concerned about the content? Get in touch with us directly. Alternatively, email editorial-team (at) simplywallst.com.
This article by Simply Wall St is general in nature. We provide commentary based on historical data and analyst forecasts only using an unbiased methodology and our articles are not intended to be financial advice. It does not constitute a recommendation to buy or sell any stock, and does not take account of your objectives, or your financial situation. We aim to bring you long-term focused analysis driven by fundamental data. Note that our analysis may not factor in the latest price-sensitive company announcements or qualitative material. Simply Wall St has no position in any stocks mentioned.
About KOSDAQ:A200470
APACT
Manufactures and sells semiconductor testing equipment in South Korea.
Mediocre balance sheet with very low risk.
Market Insights

Advertisement
Community Narratives
MicroVision will explode future revenue by 380.37% with a vision towards success
Fair Value US$60.00|98.5% undervalued
TH
Community Contributor
The Indispensable Artery for a New North American Economy
Fair Value CA$132.87|2.3% undervalued
TI
Community Contributor