
Advertisement
- South Korea
- /
- Semiconductors
- /
- KOSDAQ:A095910
Is S-EnergyLtd (KOSDAQ:095910) Weighed On By Its Debt Load?
Some say volatility, rather than debt, is the best way to think about risk as an investor, but Warren Buffett famously said that 'Volatility is far from synonymous with risk.' When we think about how risky a company is, we always like to look at its use of debt, since debt overload can lead to ruin. Importantly, S-Energy Co.,Ltd. (KOSDAQ:095910) does carry debt. But should shareholders be worried about its use of debt?
We've discovered 2 warning signs about S-EnergyLtd. View them for free.When Is Debt A Problem?
Debt is a tool to help businesses grow, but if a business is incapable of paying off its lenders, then it exists at their mercy. If things get really bad, the lenders can take control of the business. However, a more frequent (but still costly) occurrence is where a company must issue shares at bargain-basement prices, permanently diluting shareholders, just to shore up its balance sheet. Of course, the upside of debt is that it often represents cheap capital, especially when it replaces dilution in a company with the ability to reinvest at high rates of return. The first thing to do when considering how much debt a business uses is to look at its cash and debt together.
How Much Debt Does S-EnergyLtd Carry?
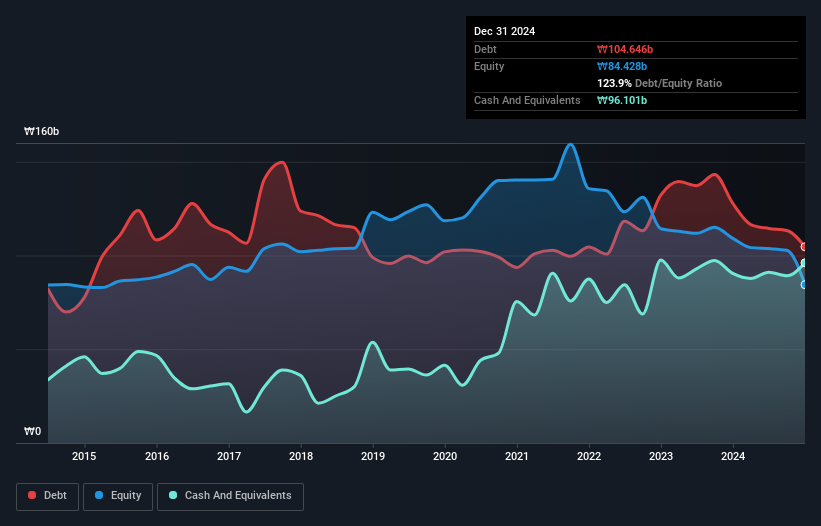
The image below, which you can click on for greater detail, shows that S-EnergyLtd had debt of ₩104.6b at the end of December 2024, a reduction from ₩127.8b over a year. However, it also had ₩96.1b in cash, and so its net debt is ₩8.54b.
How Strong Is S-EnergyLtd's Balance Sheet?
According to the last reported balance sheet, S-EnergyLtd had liabilities of ₩170.9b due within 12 months, and liabilities of ₩32.6b due beyond 12 months. On the other hand, it had cash of ₩96.1b and ₩50.2b worth of receivables due within a year. So it has liabilities totalling ₩57.1b more than its cash and near-term receivables, combined.
The deficiency here weighs heavily on the ₩31.1b company itself, as if a child were struggling under the weight of an enormous back-pack full of books, his sports gear, and a trumpet. So we definitely think shareholders need to watch this one closely. After all, S-EnergyLtd would likely require a major re-capitalisation if it had to pay its creditors today. When analysing debt levels, the balance sheet is the obvious place to start. But it is S-EnergyLtd's earnings that will influence how the balance sheet holds up in the future. So if you're keen to discover more about its earnings, it might be worth checking out this graph of its long term earnings trend.
Check out our latest analysis for S-EnergyLtd
Over 12 months, S-EnergyLtd made a loss at the EBIT level, and saw its revenue drop to ₩148b, which is a fall of 13%. We would much prefer see growth.
Caveat Emptor
Not only did S-EnergyLtd's revenue slip over the last twelve months, but it also produced negative earnings before interest and tax (EBIT). Indeed, it lost a very considerable ₩15b at the EBIT level. When we look at that alongside the significant liabilities, we're not particularly confident about the company. It would need to improve its operations quickly for us to be interested in it. For example, we would not want to see a repeat of last year's loss of ₩25b. And until that time we think this is a risky stock. The balance sheet is clearly the area to focus on when you are analysing debt. However, not all investment risk resides within the balance sheet - far from it. For example S-EnergyLtd has 2 warning signs (and 1 which shouldn't be ignored) we think you should know about.
If, after all that, you're more interested in a fast growing company with a rock-solid balance sheet, then check out our list of net cash growth stocks without delay.
New: Manage All Your Stock Portfolios in One Place
We've created the ultimate portfolio companion for stock investors, and it's free.
• Connect an unlimited number of Portfolios and see your total in one currency
• Be alerted to new Warning Signs or Risks via email or mobile
• Track the Fair Value of your stocks
Have feedback on this article? Concerned about the content? Get in touch with us directly. Alternatively, email editorial-team (at) simplywallst.com.
This article by Simply Wall St is general in nature. We provide commentary based on historical data and analyst forecasts only using an unbiased methodology and our articles are not intended to be financial advice. It does not constitute a recommendation to buy or sell any stock, and does not take account of your objectives, or your financial situation. We aim to bring you long-term focused analysis driven by fundamental data. Note that our analysis may not factor in the latest price-sensitive company announcements or qualitative material. Simply Wall St has no position in any stocks mentioned.
About KOSDAQ:A095910
S-EnergyLtd
A solar company, manufactures and sells PV modules in South Korea and internationally.
Excellent balance sheet with low risk.
Market Insights

Advertisement
Community Narratives
MicroVision will explode future revenue by 380.37% with a vision towards success
Fair Value US$60.00|98.4% undervalued
TH
Community Contributor
The Indispensable Artery for a New North American Economy
Fair Value CA$132.87|1.3% undervalued
TI
Community Contributor