- South Korea
- /
- Semiconductors
- /
- KOSDAQ:A092870
Even though Exicon (KOSDAQ:092870) has lost ₩19b market cap in last 7 days, shareholders are still up 182% over 5 years


Exicon Co., Ltd. (KOSDAQ:092870) shareholders might understandably be very concerned that the share price has dropped 36% in the last quarter. But that scarcely detracts from the really solid long term returns generated by the company over five years. In fact, the share price is 159% higher today. Generally speaking the long term returns will give you a better idea of business quality than short periods can. Only time will tell if there is still too much optimism currently reflected in the share price.
While the stock has fallen 10% this week, it's worth focusing on the longer term and seeing if the stocks historical returns have been driven by the underlying fundamentals.
View our latest analysis for Exicon
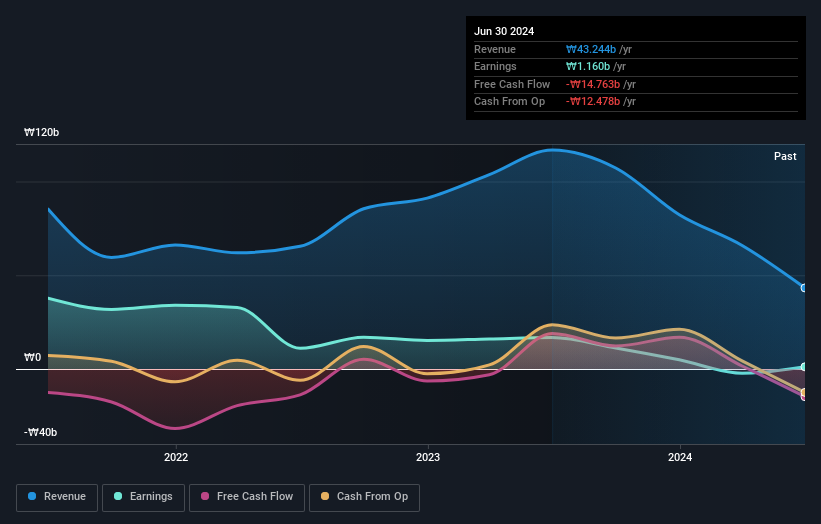
While Exicon made a small profit, in the last year, we think that the market is probably more focussed on the top line growth at the moment. As a general rule, we think this kind of company is more comparable to loss-making stocks, since the actual profit is so low. It would be hard to believe in a more profitable future without growing revenues.
In the last 5 years Exicon saw its revenue grow at 16% per year. Even measured against other revenue-focussed companies, that's a good result. So it's not entirely surprising that the share price reflected this performance by increasing at a rate of 21% per year, in that time. This suggests the market has well and truly recognized the progress the business has made. To our minds that makes Exicon worth investigating - it may have its best days ahead.
You can see how earnings and revenue have changed over time in the image below (click on the chart to see the exact values).
Take a more thorough look at Exicon's financial health with this free report on its balance sheet.
What About Dividends?
When looking at investment returns, it is important to consider the difference between total shareholder return (TSR) and share price return. Whereas the share price return only reflects the change in the share price, the TSR includes the value of dividends (assuming they were reinvested) and the benefit of any discounted capital raising or spin-off. Arguably, the TSR gives a more comprehensive picture of the return generated by a stock. As it happens, Exicon's TSR for the last 5 years was 182%, which exceeds the share price return mentioned earlier. And there's no prize for guessing that the dividend payments largely explain the divergence!
A Different Perspective
Investors in Exicon had a tough year, with a total loss of 5.9% (including dividends), against a market gain of about 4.8%. However, keep in mind that even the best stocks will sometimes underperform the market over a twelve month period. On the bright side, long term shareholders have made money, with a gain of 23% per year over half a decade. If the fundamental data continues to indicate long term sustainable growth, the current sell-off could be an opportunity worth considering. While it is well worth considering the different impacts that market conditions can have on the share price, there are other factors that are even more important. Take risks, for example - Exicon has 3 warning signs (and 1 which is potentially serious) we think you should know about.
Of course Exicon may not be the best stock to buy. So you may wish to see this free collection of growth stocks.
Please note, the market returns quoted in this article reflect the market weighted average returns of stocks that currently trade on South Korean exchanges.
Valuation is complex, but we're here to simplify it.
Discover if Exicon might be undervalued or overvalued with our detailed analysis, featuring fair value estimates, potential risks, dividends, insider trades, and its financial condition.
Access Free AnalysisHave feedback on this article? Concerned about the content? Get in touch with us directly. Alternatively, email editorial-team (at) simplywallst.com.
This article by Simply Wall St is general in nature. We provide commentary based on historical data and analyst forecasts only using an unbiased methodology and our articles are not intended to be financial advice. It does not constitute a recommendation to buy or sell any stock, and does not take account of your objectives, or your financial situation. We aim to bring you long-term focused analysis driven by fundamental data. Note that our analysis may not factor in the latest price-sensitive company announcements or qualitative material. Simply Wall St has no position in any stocks mentioned.
About KOSDAQ:A092870
Exicon
Operates as a semiconductor test solution company in Korea and internationally.
Adequate balance sheet low.
