
Advertisement
- South Korea
- /
- Personal Products
- /
- KOSDAQ:A080530
KODI (KOSDAQ:080530) Could Be At Risk Of Shrinking As A Company
If we're looking to avoid a business that is in decline, what are the trends that can warn us ahead of time? A business that's potentially in decline often shows two trends, a return on capital employed (ROCE) that's declining, and a base of capital employed that's also declining. Ultimately this means that the company is earning less per dollar invested and on top of that, it's shrinking its base of capital employed. Having said that, after a brief look, KODI (KOSDAQ:080530) we aren't filled with optimism, but let's investigate further.
Understanding Return On Capital Employed (ROCE)
For those who don't know, ROCE is a measure of a company's yearly pre-tax profit (its return), relative to the capital employed in the business. To calculate this metric for KODI, this is the formula:
Return on Capital Employed = Earnings Before Interest and Tax (EBIT) ÷ (Total Assets - Current Liabilities)
0.000076 = ₩4.4m ÷ (₩81b - ₩22b) (Based on the trailing twelve months to September 2024).
Thus, KODI has an ROCE of 0.008%. In absolute terms, that's a low return and it also under-performs the Semiconductor industry average of 6.5%.
See our latest analysis for KODI
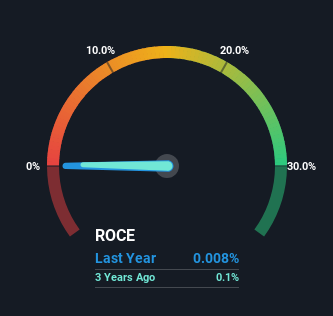
Historical performance is a great place to start when researching a stock so above you can see the gauge for KODI's ROCE against it's prior returns. If you'd like to look at how KODI has performed in the past in other metrics, you can view this free graph of KODI's past earnings, revenue and cash flow.
What Does the ROCE Trend For KODI Tell Us?
We are a bit worried about the trend of returns on capital at KODI. About five years ago, returns on capital were 0.2%, however they're now substantially lower than that as we saw above. Meanwhile, capital employed in the business has stayed roughly the flat over the period. This combination can be indicative of a mature business that still has areas to deploy capital, but the returns received aren't as high due potentially to new competition or smaller margins. If these trends continue, we wouldn't expect KODI to turn into a multi-bagger.
What We Can Learn From KODI's ROCE
In the end, the trend of lower returns on the same amount of capital isn't typically an indication that we're looking at a growth stock. It should come as no surprise then that the stock has fallen 16% over the last three years, so it looks like investors are recognizing these changes. With underlying trends that aren't great in these areas, we'd consider looking elsewhere.
One final note, you should learn about the 3 warning signs we've spotted with KODI (including 2 which can't be ignored) .
While KODI isn't earning the highest return, check out this free list of companies that are earning high returns on equity with solid balance sheets.
Valuation is complex, but we're here to simplify it.
Discover if KODI might be undervalued or overvalued with our detailed analysis, featuring fair value estimates, potential risks, dividends, insider trades, and its financial condition.
Access Free AnalysisHave feedback on this article? Concerned about the content? Get in touch with us directly. Alternatively, email editorial-team (at) simplywallst.com.
This article by Simply Wall St is general in nature. We provide commentary based on historical data and analyst forecasts only using an unbiased methodology and our articles are not intended to be financial advice. It does not constitute a recommendation to buy or sell any stock, and does not take account of your objectives, or your financial situation. We aim to bring you long-term focused analysis driven by fundamental data. Note that our analysis may not factor in the latest price-sensitive company announcements or qualitative material. Simply Wall St has no position in any stocks mentioned.
About KOSDAQ:A080530
KODI
Manufactures and sells cosmetics and cosmetic containers in South Korea.
Excellent balance sheet with low risk.
Market Insights

Advertisement
Community Narratives
The company that turned a verb into a global necessity and basically runs the modern internet, digital ads, smartphones, maps, and AI.
Fair Value US$300.00|6.3% undervalued
OS
Community Contributor
Flowers Foods Pays A Fair Price For Health
Fair Value US$16.12|26.0% undervalued
NV
Community Contributor
TMX Group will thrive with 33.3% profit margin and enduring market moat
Fair Value CA$49.90|3.7% overvalued
LI
Community Contributor