
Advertisement
- South Korea
- /
- Semiconductors
- /
- KOSDAQ:A052900
Here's What To Make Of Kx Hitech's (KOSDAQ:052900) Decelerating Rates Of Return
What are the early trends we should look for to identify a stock that could multiply in value over the long term? In a perfect world, we'd like to see a company investing more capital into its business and ideally the returns earned from that capital are also increasing. Put simply, these types of businesses are compounding machines, meaning they are continually reinvesting their earnings at ever-higher rates of return. In light of that, when we looked at Kx Hitech (KOSDAQ:052900) and its ROCE trend, we weren't exactly thrilled.
Return On Capital Employed (ROCE): What Is It?
For those who don't know, ROCE is a measure of a company's yearly pre-tax profit (its return), relative to the capital employed in the business. To calculate this metric for Kx Hitech, this is the formula:
Return on Capital Employed = Earnings Before Interest and Tax (EBIT) ÷ (Total Assets - Current Liabilities)
0.058 = ₩8.1b ÷ (₩195b - ₩56b) (Based on the trailing twelve months to December 2023).
Thus, Kx Hitech has an ROCE of 5.8%. In absolute terms, that's a low return but it's around the Semiconductor industry average of 5.4%.
Check out our latest analysis for Kx Hitech
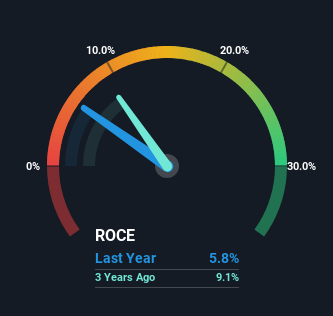
While the past is not representative of the future, it can be helpful to know how a company has performed historically, which is why we have this chart above. If you'd like to look at how Kx Hitech has performed in the past in other metrics, you can view this free graph of Kx Hitech's past earnings, revenue and cash flow.
The Trend Of ROCE
There are better returns on capital out there than what we're seeing at Kx Hitech. The company has consistently earned 5.8% for the last five years, and the capital employed within the business has risen 104% in that time. This poor ROCE doesn't inspire confidence right now, and with the increase in capital employed, it's evident that the business isn't deploying the funds into high return investments.
On another note, while the change in ROCE trend might not scream for attention, it's interesting that the current liabilities have actually gone up over the last five years. This is intriguing because if current liabilities hadn't increased to 29% of total assets, this reported ROCE would probably be less than5.8% because total capital employed would be higher.The 5.8% ROCE could be even lower if current liabilities weren't 29% of total assets, because the the formula would show a larger base of total capital employed. With that in mind, just be wary if this ratio increases in the future, because if it gets particularly high, this brings with it some new elements of risk.
What We Can Learn From Kx Hitech's ROCE
In conclusion, Kx Hitech has been investing more capital into the business, but returns on that capital haven't increased. And with the stock having returned a mere 17% in the last five years to shareholders, you could argue that they're aware of these lackluster trends. As a result, if you're hunting for a multi-bagger, we think you'd have more luck elsewhere.
One more thing to note, we've identified 3 warning signs with Kx Hitech and understanding them should be part of your investment process.
If you want to search for solid companies with great earnings, check out this free list of companies with good balance sheets and impressive returns on equity.
Valuation is complex, but we're here to simplify it.
Discover if Kx Hitech might be undervalued or overvalued with our detailed analysis, featuring fair value estimates, potential risks, dividends, insider trades, and its financial condition.
Access Free AnalysisHave feedback on this article? Concerned about the content? Get in touch with us directly. Alternatively, email editorial-team (at) simplywallst.com.
This article by Simply Wall St is general in nature. We provide commentary based on historical data and analyst forecasts only using an unbiased methodology and our articles are not intended to be financial advice. It does not constitute a recommendation to buy or sell any stock, and does not take account of your objectives, or your financial situation. We aim to bring you long-term focused analysis driven by fundamental data. Note that our analysis may not factor in the latest price-sensitive company announcements or qualitative material. Simply Wall St has no position in any stocks mentioned.
About KOSDAQ:A052900
Kx Hitech
Kx Hitech Co., Ltd. manufacture and sell semiconductor process materials.
Good value with adequate balance sheet.
Market Insights

Advertisement
Community Narratives
MicroVision will explode future revenue by 380.37% with a vision towards success
Fair Value US$60.00|98.5% undervalued
TH
Community Contributor
The Indispensable Artery for a New North American Economy
Fair Value CA$132.87|2.3% undervalued
TI
Community Contributor