
Advertisement
- South Korea
- /
- Semiconductors
- /
- KOSDAQ:A039440
These 4 Measures Indicate That STI (KOSDAQ:039440) Is Using Debt Reasonably Well
Legendary fund manager Li Lu (who Charlie Munger backed) once said, 'The biggest investment risk is not the volatility of prices, but whether you will suffer a permanent loss of capital.' So it might be obvious that you need to consider debt, when you think about how risky any given stock is, because too much debt can sink a company. We note that STI Co., Ltd. (KOSDAQ:039440) does have debt on its balance sheet. But the real question is whether this debt is making the company risky.
Why Does Debt Bring Risk?
Generally speaking, debt only becomes a real problem when a company can't easily pay it off, either by raising capital or with its own cash flow. Part and parcel of capitalism is the process of 'creative destruction' where failed businesses are mercilessly liquidated by their bankers. However, a more common (but still painful) scenario is that it has to raise new equity capital at a low price, thus permanently diluting shareholders. Of course, plenty of companies use debt to fund growth, without any negative consequences. The first step when considering a company's debt levels is to consider its cash and debt together.
What Is STI's Net Debt?
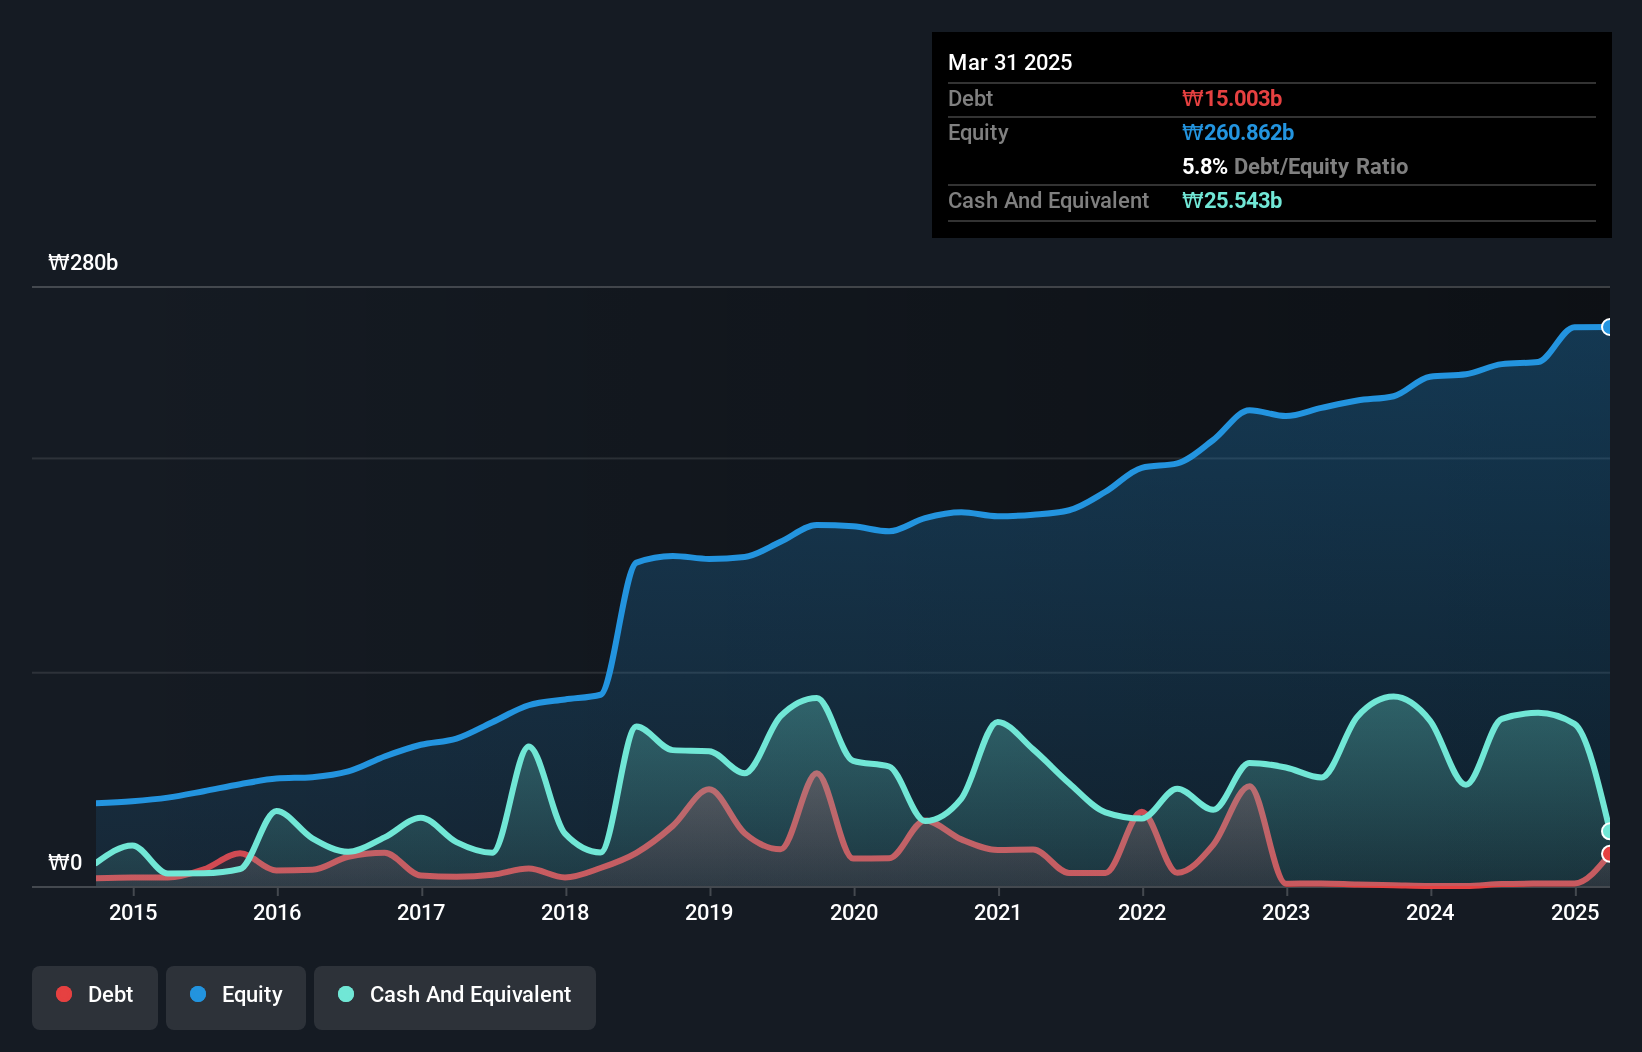
As you can see below, at the end of March 2025, STI had ₩15.0b of debt, up from none a year ago. Click the image for more detail. But it also has ₩25.5b in cash to offset that, meaning it has ₩10.5b net cash.
A Look At STI's Liabilities
According to the last reported balance sheet, STI had liabilities of ₩83.1b due within 12 months, and liabilities of ₩1.42b due beyond 12 months. On the other hand, it had cash of ₩25.5b and ₩65.5b worth of receivables due within a year. So it actually has ₩6.49b more liquid assets than total liabilities.
This surplus suggests that STI has a conservative balance sheet, and could probably eliminate its debt without much difficulty. Succinctly put, STI boasts net cash, so it's fair to say it does not have a heavy debt load!
Check out our latest analysis for STI
On top of that, STI grew its EBIT by 59% over the last twelve months, and that growth will make it easier to handle its debt. There's no doubt that we learn most about debt from the balance sheet. But ultimately the future profitability of the business will decide if STI can strengthen its balance sheet over time. So if you're focused on the future you can check out this free report showing analyst profit forecasts.
Finally, while the tax-man may adore accounting profits, lenders only accept cold hard cash. STI may have net cash on the balance sheet, but it is still interesting to look at how well the business converts its earnings before interest and tax (EBIT) to free cash flow, because that will influence both its need for, and its capacity to manage debt. Over the last three years, STI recorded negative free cash flow, in total. Debt is far more risky for companies with unreliable free cash flow, so shareholders should be hoping that the past expenditure will produce free cash flow in the future.
Summing Up
While it is always sensible to investigate a company's debt, in this case STI has ₩10.5b in net cash and a decent-looking balance sheet. And it impressed us with its EBIT growth of 59% over the last year. So we don't have any problem with STI's use of debt. When analysing debt levels, the balance sheet is the obvious place to start. However, not all investment risk resides within the balance sheet - far from it. For example, we've discovered 1 warning sign for STI that you should be aware of before investing here.
If, after all that, you're more interested in a fast growing company with a rock-solid balance sheet, then check out our list of net cash growth stocks without delay.
New: Manage All Your Stock Portfolios in One Place
We've created the ultimate portfolio companion for stock investors, and it's free.
• Connect an unlimited number of Portfolios and see your total in one currency
• Be alerted to new Warning Signs or Risks via email or mobile
• Track the Fair Value of your stocks
Have feedback on this article? Concerned about the content? Get in touch with us directly. Alternatively, email editorial-team (at) simplywallst.com.
This article by Simply Wall St is general in nature. We provide commentary based on historical data and analyst forecasts only using an unbiased methodology and our articles are not intended to be financial advice. It does not constitute a recommendation to buy or sell any stock, and does not take account of your objectives, or your financial situation. We aim to bring you long-term focused analysis driven by fundamental data. Note that our analysis may not factor in the latest price-sensitive company announcements or qualitative material. Simply Wall St has no position in any stocks mentioned.
About KOSDAQ:A039440
Very undervalued with flawless balance sheet.
Market Insights

Advertisement
Community Narratives
MicroVision will explode future revenue by 380.37% with a vision towards success
Fair Value US$60|98.4% undervalued
TH
Community Contributor
The Indispensable Artery for a New North American Economy
Fair Value CA$132.87|1.6% undervalued
TI
Community Contributor
Recently Updated Narratives
BE


Bejgal on MINISO Group Holding ·
MINISO's fair value is projected at 26.69 with an anticipated PE ratio shift of 20x
Fair Value:US$26.6928.0% undervalued
44 followersusers have followed this narrative
3 commentsusers have commented on this narrative
0 likesusers have liked this narrative
TI


TickerTickle on Oracle ·
The Quiet Giant That Became AI’s Power Grid
Fair Value:US$389.8149.5% undervalued
7 followersusers have followed this narrative
0 commentsusers have commented on this narrative
0 likesusers have liked this narrative
AU

AuCA on Nova Ljubljanska Banka d.d ·
Nova Ljubljanska Banka d.d will expect a 11.2% revenue boost driving future growth
Fair Value:€20916.3% undervalued
23 followersusers have followed this narrative
3 commentsusers have commented on this narrative
0 likesusers have liked this narrative
Popular Narratives
OS


oscargarcia on Alphabet ·
The company that turned a verb into a global necessity and basically runs the modern internet, digital ads, smartphones, maps, and AI.
Fair Value:US$3404.9% undervalued
134 followersusers have followed this narrative
6 commentsusers have commented on this narrative
18 likesusers have liked this narrative
TH

TheWallstreetKing on MicroVision ·
MicroVision will explode future revenue by 380.37% with a vision towards success
Fair Value:US$6098.4% undervalued
83 followersusers have followed this narrative
10 commentsusers have commented on this narrative
18 likesusers have liked this narrative
AN


AnalystConsensusTarget on NVIDIA ·
NVDA: Expanding AI Demand Will Drive Major Data Center Investments Through 2026
Fair Value:US$232.7923.6% undervalued
919 followersusers have followed this narrative
5 commentsusers have commented on this narrative
21 likesusers have liked this narrative