
Advertisement
- South Korea
- /
- Semiconductors
- /
- KOSDAQ:A039030
Does EO Technics (KOSDAQ:039030) Have A Healthy Balance Sheet?
Legendary fund manager Li Lu (who Charlie Munger backed) once said, 'The biggest investment risk is not the volatility of prices, but whether you will suffer a permanent loss of capital.' When we think about how risky a company is, we always like to look at its use of debt, since debt overload can lead to ruin. We can see that EO Technics Co., Ltd. (KOSDAQ:039030) does use debt in its business. But the real question is whether this debt is making the company risky.
When Is Debt Dangerous?
Debt is a tool to help businesses grow, but if a business is incapable of paying off its lenders, then it exists at their mercy. Part and parcel of capitalism is the process of 'creative destruction' where failed businesses are mercilessly liquidated by their bankers. However, a more usual (but still expensive) situation is where a company must dilute shareholders at a cheap share price simply to get debt under control. Of course, plenty of companies use debt to fund growth, without any negative consequences. When we examine debt levels, we first consider both cash and debt levels, together.
Check out our latest analysis for EO Technics
What Is EO Technics's Net Debt?
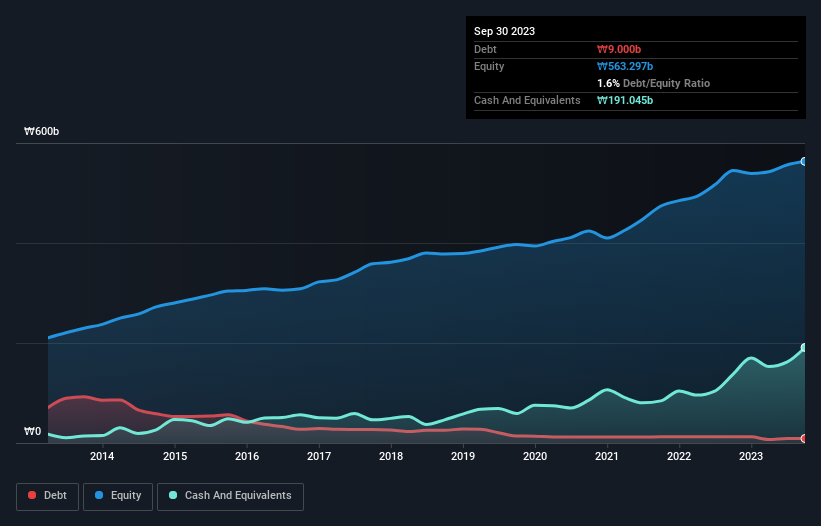
As you can see below, EO Technics had ₩9.00b of debt at September 2023, down from ₩12.5b a year prior. But on the other hand it also has ₩191.0b in cash, leading to a ₩182.0b net cash position.
A Look At EO Technics' Liabilities
Zooming in on the latest balance sheet data, we can see that EO Technics had liabilities of ₩42.6b due within 12 months and liabilities of ₩334.9m due beyond that. Offsetting these obligations, it had cash of ₩191.0b as well as receivables valued at ₩84.8b due within 12 months. So it can boast ₩232.9b more liquid assets than total liabilities.
This surplus suggests that EO Technics has a conservative balance sheet, and could probably eliminate its debt without much difficulty. Simply put, the fact that EO Technics has more cash than debt is arguably a good indication that it can manage its debt safely.
The modesty of its debt load may become crucial for EO Technics if management cannot prevent a repeat of the 54% cut to EBIT over the last year. Falling earnings (if the trend continues) could eventually make even modest debt quite risky. When analysing debt levels, the balance sheet is the obvious place to start. But ultimately the future profitability of the business will decide if EO Technics can strengthen its balance sheet over time. So if you want to see what the professionals think, you might find this free report on analyst profit forecasts to be interesting.
Finally, a company can only pay off debt with cold hard cash, not accounting profits. While EO Technics has net cash on its balance sheet, it's still worth taking a look at its ability to convert earnings before interest and tax (EBIT) to free cash flow, to help us understand how quickly it is building (or eroding) that cash balance. During the last three years, EO Technics produced sturdy free cash flow equating to 65% of its EBIT, about what we'd expect. This cold hard cash means it can reduce its debt when it wants to.
Summing Up
While it is always sensible to investigate a company's debt, in this case EO Technics has ₩182.0b in net cash and a decent-looking balance sheet. So we don't have any problem with EO Technics's use of debt. When analysing debt levels, the balance sheet is the obvious place to start. However, not all investment risk resides within the balance sheet - far from it. Case in point: We've spotted 3 warning signs for EO Technics you should be aware of.
Of course, if you're the type of investor who prefers buying stocks without the burden of debt, then don't hesitate to discover our exclusive list of net cash growth stocks, today.
Valuation is complex, but we're here to simplify it.
Discover if EO Technics might be undervalued or overvalued with our detailed analysis, featuring fair value estimates, potential risks, dividends, insider trades, and its financial condition.
Access Free AnalysisHave feedback on this article? Concerned about the content? Get in touch with us directly. Alternatively, email editorial-team (at) simplywallst.com.
This article by Simply Wall St is general in nature. We provide commentary based on historical data and analyst forecasts only using an unbiased methodology and our articles are not intended to be financial advice. It does not constitute a recommendation to buy or sell any stock, and does not take account of your objectives, or your financial situation. We aim to bring you long-term focused analysis driven by fundamental data. Note that our analysis may not factor in the latest price-sensitive company announcements or qualitative material. Simply Wall St has no position in any stocks mentioned.
About KOSDAQ:A039030
EO Technics
Manufactures and supplies laser processing equipment worldwide.
Flawless balance sheet with reasonable growth potential.
Similar Companies
Market Insights

Advertisement
Community Narratives
MicroVision will explode future revenue by 380.37% with a vision towards success
Fair Value US$60.00|98.5% undervalued
TH
Community Contributor
The Indispensable Artery for a New North American Economy
Fair Value CA$132.87|2.3% undervalued
TI
Community Contributor