
Advertisement
- South Korea
- /
- Semiconductors
- /
- KOSDAQ:A030530
Improved Revenues Required Before Wonik Holdings Co.,Ltd. (KOSDAQ:030530) Stock's 56% Jump Looks Justified
Wonik Holdings Co.,Ltd. (KOSDAQ:030530) shareholders have had their patience rewarded with a 56% share price jump in the last month. Notwithstanding the latest gain, the annual share price return of 5.9% isn't as impressive.
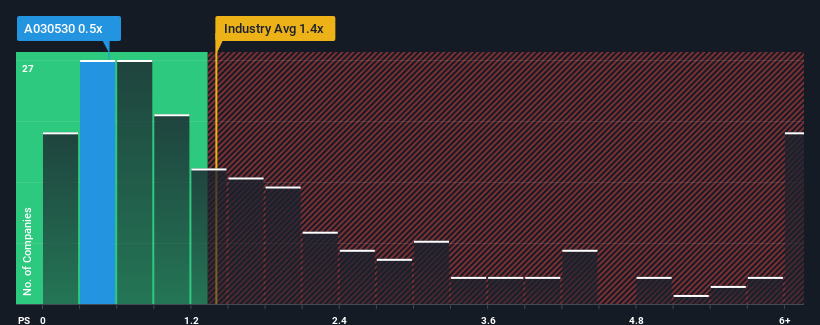
In spite of the firm bounce in price, considering around half the companies operating in Korea's Semiconductor industry have price-to-sales ratios (or "P/S") above 1.4x, you may still consider Wonik HoldingsLtd as an solid investment opportunity with its 0.5x P/S ratio. Nonetheless, we'd need to dig a little deeper to determine if there is a rational basis for the reduced P/S.
See our latest analysis for Wonik HoldingsLtd
How Has Wonik HoldingsLtd Performed Recently?
As an illustration, revenue has deteriorated at Wonik HoldingsLtd over the last year, which is not ideal at all. It might be that many expect the disappointing revenue performance to continue or accelerate, which has repressed the P/S. Those who are bullish on Wonik HoldingsLtd will be hoping that this isn't the case so that they can pick up the stock at a lower valuation.
Want the full picture on earnings, revenue and cash flow for the company? Then our free report on Wonik HoldingsLtd will help you shine a light on its historical performance.Do Revenue Forecasts Match The Low P/S Ratio?
The only time you'd be truly comfortable seeing a P/S as low as Wonik HoldingsLtd's is when the company's growth is on track to lag the industry.
In reviewing the last year of financials, we were disheartened to see the company's revenues fell to the tune of 26%. The last three years don't look nice either as the company has shrunk revenue by 22% in aggregate. So unfortunately, we have to acknowledge that the company has not done a great job of growing revenue over that time.
Weighing that medium-term revenue trajectory against the broader industry's one-year forecast for expansion of 40% shows it's an unpleasant look.
With this information, we are not surprised that Wonik HoldingsLtd is trading at a P/S lower than the industry. However, we think shrinking revenues are unlikely to lead to a stable P/S over the longer term, which could set up shareholders for future disappointment. Even just maintaining these prices could be difficult to achieve as recent revenue trends are already weighing down the shares.
What Does Wonik HoldingsLtd's P/S Mean For Investors?
Wonik HoldingsLtd's stock price has surged recently, but its but its P/S still remains modest. Using the price-to-sales ratio alone to determine if you should sell your stock isn't sensible, however it can be a practical guide to the company's future prospects.
It's no surprise that Wonik HoldingsLtd maintains its low P/S off the back of its sliding revenue over the medium-term. Right now shareholders are accepting the low P/S as they concede future revenue probably won't provide any pleasant surprises either. If recent medium-term revenue trends continue, it's hard to see the share price moving strongly in either direction in the near future under these circumstances.
It's always necessary to consider the ever-present spectre of investment risk. We've identified 2 warning signs with Wonik HoldingsLtd, and understanding them should be part of your investment process.
If these risks are making you reconsider your opinion on Wonik HoldingsLtd, explore our interactive list of high quality stocks to get an idea of what else is out there.
Valuation is complex, but we're here to simplify it.
Discover if Wonik HoldingsLtd might be undervalued or overvalued with our detailed analysis, featuring fair value estimates, potential risks, dividends, insider trades, and its financial condition.
Access Free AnalysisHave feedback on this article? Concerned about the content? Get in touch with us directly. Alternatively, email editorial-team (at) simplywallst.com.
This article by Simply Wall St is general in nature. We provide commentary based on historical data and analyst forecasts only using an unbiased methodology and our articles are not intended to be financial advice. It does not constitute a recommendation to buy or sell any stock, and does not take account of your objectives, or your financial situation. We aim to bring you long-term focused analysis driven by fundamental data. Note that our analysis may not factor in the latest price-sensitive company announcements or qualitative material. Simply Wall St has no position in any stocks mentioned.
About KOSDAQ:A030530
Wonik HoldingsLtd
Manufactures and sells semiconductor and electronic equipment, and other products.
Imperfect balance sheet with very low risk.
Market Insights

Advertisement
Community Narratives
MicroVision will explode future revenue by 380.37% with a vision towards success
Fair Value US$60.00|98.5% undervalued
TH
Community Contributor
The Indispensable Artery for a New North American Economy
Fair Value CA$132.87|2.3% undervalued
TI
Community Contributor