
Advertisement
Howard Marks put it nicely when he said that, rather than worrying about share price volatility, 'The possibility of permanent loss is the risk I worry about... and every practical investor I know worries about.' It's only natural to consider a company's balance sheet when you examine how risky it is, since debt is often involved when a business collapses. As with many other companies Daewoong Co., Ltd. (KRX:003090) makes use of debt. But the more important question is: how much risk is that debt creating?
When Is Debt A Problem?
Debt assists a business until the business has trouble paying it off, either with new capital or with free cash flow. In the worst case scenario, a company can go bankrupt if it cannot pay its creditors. However, a more usual (but still expensive) situation is where a company must dilute shareholders at a cheap share price simply to get debt under control. Having said that, the most common situation is where a company manages its debt reasonably well - and to its own advantage. When we think about a company's use of debt, we first look at cash and debt together.
Check out our latest analysis for Daewoong
What Is Daewoong's Net Debt?
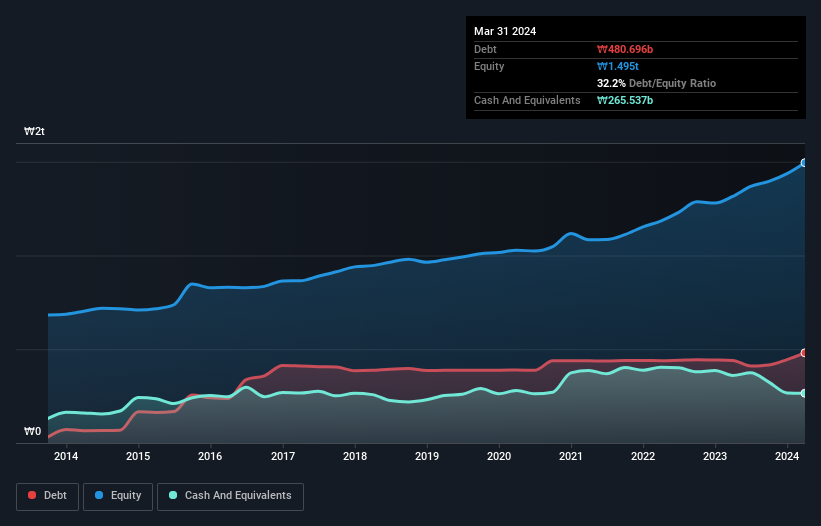
As you can see below, at the end of March 2024, Daewoong had ₩480.7b of debt, up from ₩439.9b a year ago. Click the image for more detail. However, it does have ₩265.5b in cash offsetting this, leading to net debt of about ₩215.2b.
How Healthy Is Daewoong's Balance Sheet?
The latest balance sheet data shows that Daewoong had liabilities of ₩730.5b due within a year, and liabilities of ₩241.1b falling due after that. Offsetting these obligations, it had cash of ₩265.5b as well as receivables valued at ₩206.2b due within 12 months. So it has liabilities totalling ₩499.8b more than its cash and near-term receivables, combined.
This deficit is considerable relative to its market capitalization of ₩819.9b, so it does suggest shareholders should keep an eye on Daewoong's use of debt. Should its lenders demand that it shore up the balance sheet, shareholders would likely face severe dilution.
In order to size up a company's debt relative to its earnings, we calculate its net debt divided by its earnings before interest, tax, depreciation, and amortization (EBITDA) and its earnings before interest and tax (EBIT) divided by its interest expense (its interest cover). This way, we consider both the absolute quantum of the debt, as well as the interest rates paid on it.
Daewoong's net debt is only 0.86 times its EBITDA. And its EBIT easily covers its interest expense, being 43.4 times the size. So you could argue it is no more threatened by its debt than an elephant is by a mouse. But the other side of the story is that Daewoong saw its EBIT decline by 6.2% over the last year. That sort of decline, if sustained, will obviously make debt harder to handle. When analysing debt levels, the balance sheet is the obvious place to start. But you can't view debt in total isolation; since Daewoong will need earnings to service that debt. So if you're keen to discover more about its earnings, it might be worth checking out this graph of its long term earnings trend.
Finally, a company can only pay off debt with cold hard cash, not accounting profits. So we clearly need to look at whether that EBIT is leading to corresponding free cash flow. Over the last three years, Daewoong barely recorded positive free cash flow, in total. While many companies do operate at break-even, we prefer see substantial free cash flow, especially if a it already has dead.
Our View
Neither Daewoong's ability to convert EBIT to free cash flow nor its EBIT growth rate gave us confidence in its ability to take on more debt. But its interest cover tells a very different story, and suggests some resilience. Taking the abovementioned factors together we do think Daewoong's debt poses some risks to the business. While that debt can boost returns, we think the company has enough leverage now. Above most other metrics, we think its important to track how fast earnings per share is growing, if at all. If you've also come to that realization, you're in luck, because today you can view this interactive graph of Daewoong's earnings per share history for free.
If, after all that, you're more interested in a fast growing company with a rock-solid balance sheet, then check out our list of net cash growth stocks without delay.
New: Manage All Your Stock Portfolios in One Place
We've created the ultimate portfolio companion for stock investors, and it's free.
• Connect an unlimited number of Portfolios and see your total in one currency
• Be alerted to new Warning Signs or Risks via email or mobile
• Track the Fair Value of your stocks
Have feedback on this article? Concerned about the content? Get in touch with us directly. Alternatively, email editorial-team (at) simplywallst.com.
This article by Simply Wall St is general in nature. We provide commentary based on historical data and analyst forecasts only using an unbiased methodology and our articles are not intended to be financial advice. It does not constitute a recommendation to buy or sell any stock, and does not take account of your objectives, or your financial situation. We aim to bring you long-term focused analysis driven by fundamental data. Note that our analysis may not factor in the latest price-sensitive company announcements or qualitative material. Simply Wall St has no position in any stocks mentioned.
Have feedback on this article? Concerned about the content? Get in touch with us directly. Alternatively, email editorial-team@simplywallst.com
About KOSE:A003090
Daewoong
Engages in the manufacture and sale of pharmaceuticals in South Korea.
Excellent balance sheet and good value.
Market Insights

Advertisement
Community Narratives
The company that turned a verb into a global necessity and basically runs the modern internet, digital ads, smartphones, maps, and AI.
Fair Value US$300.00|7.5% undervalued
OS
Community Contributor
Flowers Foods Pays A Fair Price For Health
Fair Value US$16.12|25.4% undervalued
NV
Community Contributor
TMX Group will thrive with 33.3% profit margin and enduring market moat
Fair Value CA$49.90|3.6% overvalued
LI
Community Contributor
The "Molecular Pencil": Why Beam's Technology is Built to Win
Fair Value US$65.01|65.0% undervalued
DA
Community Contributor