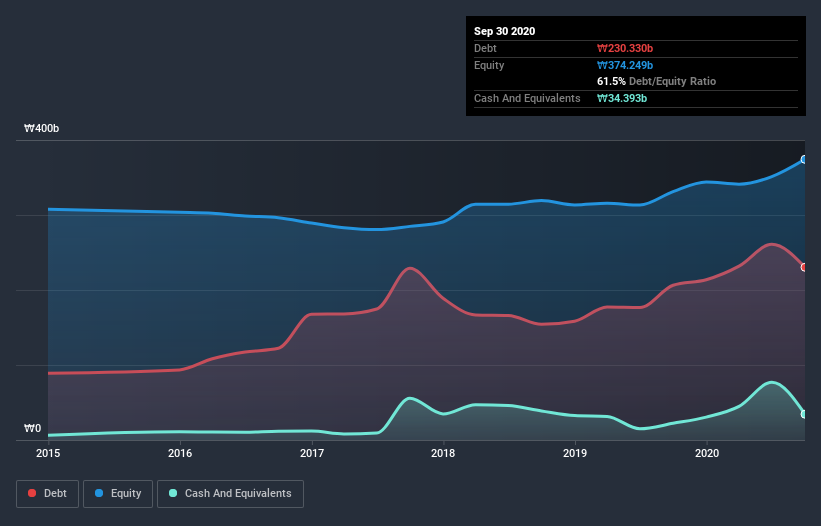
Some say volatility, rather than debt, is the best way to think about risk as an investor, but Warren Buffett famously said that 'Volatility is far from synonymous with risk.' So it seems the smart money knows that debt - which is usually involved in bankruptcies - is a very important factor, when you assess how risky a company is. Importantly, HANDOK Inc. (KRX:002390) does carry debt. But the more important question is: how much risk is that debt creating?
Why Does Debt Bring Risk?
Debt is a tool to help businesses grow, but if a business is incapable of paying off its lenders, then it exists at their mercy. If things get really bad, the lenders can take control of the business. However, a more usual (but still expensive) situation is where a company must dilute shareholders at a cheap share price simply to get debt under control. Of course, plenty of companies use debt to fund growth, without any negative consequences. The first step when considering a company's debt levels is to consider its cash and debt together.
See our latest analysis for HANDOK
What Is HANDOK's Net Debt?
As you can see below, at the end of September 2020, HANDOK had ₩230.3b of debt, up from ₩206.3b a year ago. Click the image for more detail. On the flip side, it has ₩34.4b in cash leading to net debt of about ₩195.9b.

A Look At HANDOK's Liabilities
The latest balance sheet data shows that HANDOK had liabilities of ₩234.2b due within a year, and liabilities of ₩212.1b falling due after that. Offsetting these obligations, it had cash of ₩34.4b as well as receivables valued at ₩171.2b due within 12 months. So its liabilities outweigh the sum of its cash and (near-term) receivables by ₩240.7b.
This is a mountain of leverage relative to its market capitalization of ₩381.9b. Should its lenders demand that it shore up the balance sheet, shareholders would likely face severe dilution.
In order to size up a company's debt relative to its earnings, we calculate its net debt divided by its earnings before interest, tax, depreciation, and amortization (EBITDA) and its earnings before interest and tax (EBIT) divided by its interest expense (its interest cover). The advantage of this approach is that we take into account both the absolute quantum of debt (with net debt to EBITDA) and the actual interest expenses associated with that debt (with its interest cover ratio).
HANDOK has a debt to EBITDA ratio of 3.6 and its EBIT covered its interest expense 5.1 times. Taken together this implies that, while we wouldn't want to see debt levels rise, we think it can handle its current leverage. Importantly, HANDOK grew its EBIT by 33% over the last twelve months, and that growth will make it easier to handle its debt. There's no doubt that we learn most about debt from the balance sheet. But it is HANDOK's earnings that will influence how the balance sheet holds up in the future. So when considering debt, it's definitely worth looking at the earnings trend. Click here for an interactive snapshot.
Finally, a business needs free cash flow to pay off debt; accounting profits just don't cut it. So the logical step is to look at the proportion of that EBIT that is matched by actual free cash flow. Over the last three years, HANDOK saw substantial negative free cash flow, in total. While investors are no doubt expecting a reversal of that situation in due course, it clearly does mean its use of debt is more risky.
Our View
HANDOK's conversion of EBIT to free cash flow and net debt to EBITDA definitely weigh on it, in our esteem. But the good news is it seems to be able to grow its EBIT with ease. When we consider all the factors discussed, it seems to us that HANDOK is taking some risks with its use of debt. While that debt can boost returns, we think the company has enough leverage now. When analysing debt levels, the balance sheet is the obvious place to start. But ultimately, every company can contain risks that exist outside of the balance sheet. We've identified 4 warning signs with HANDOK (at least 1 which is a bit unpleasant) , and understanding them should be part of your investment process.
At the end of the day, it's often better to focus on companies that are free from net debt. You can access our special list of such companies (all with a track record of profit growth). It's free.
When trading HANDOK or any other investment, use the platform considered by many to be the Professional's Gateway to the Worlds Market, Interactive Brokers. You get the lowest-cost* trading on stocks, options, futures, forex, bonds and funds worldwide from a single integrated account. Promoted
Valuation is complex, but we're here to simplify it.
Discover if HANDOK might be undervalued or overvalued with our detailed analysis, featuring fair value estimates, potential risks, dividends, insider trades, and its financial condition.
Access Free AnalysisThis article by Simply Wall St is general in nature. It does not constitute a recommendation to buy or sell any stock, and does not take account of your objectives, or your financial situation. We aim to bring you long-term focused analysis driven by fundamental data. Note that our analysis may not factor in the latest price-sensitive company announcements or qualitative material. Simply Wall St has no position in any stocks mentioned.
*Interactive Brokers Rated Lowest Cost Broker by StockBrokers.com Annual Online Review 2020
Have feedback on this article? Concerned about the content? Get in touch with us directly. Alternatively, email editorial-team (at) simplywallst.com.
About KOSE:A002390
Low risk and slightly overvalued.
Market Insights
Community Narratives


