
Advertisement
- South Korea
- /
- Media
- /
- KOSE:A035000
These 4 Measures Indicate That GIIR (KRX:035000) Is Using Debt Reasonably Well
The external fund manager backed by Berkshire Hathaway's Charlie Munger, Li Lu, makes no bones about it when he says 'The biggest investment risk is not the volatility of prices, but whether you will suffer a permanent loss of capital.' When we think about how risky a company is, we always like to look at its use of debt, since debt overload can lead to ruin. Importantly, GIIR Inc. (KRX:035000) does carry debt. But should shareholders be worried about its use of debt?
What Risk Does Debt Bring?
Debt assists a business until the business has trouble paying it off, either with new capital or with free cash flow. Ultimately, if the company can't fulfill its legal obligations to repay debt, shareholders could walk away with nothing. However, a more usual (but still expensive) situation is where a company must dilute shareholders at a cheap share price simply to get debt under control. Of course, debt can be an important tool in businesses, particularly capital heavy businesses. When we think about a company's use of debt, we first look at cash and debt together.
Check out our latest analysis for GIIR
What Is GIIR's Net Debt?
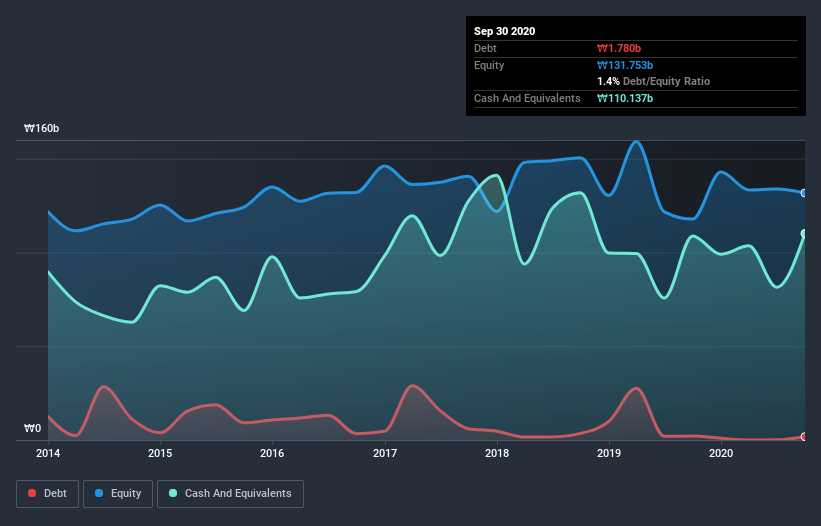
You can click the graphic below for the historical numbers, but it shows that GIIR had ₩1.78b of debt in September 2020, down from ₩2.11b, one year before. But on the other hand it also has ₩110.1b in cash, leading to a ₩108.4b net cash position.
How Strong Is GIIR's Balance Sheet?
The latest balance sheet data shows that GIIR had liabilities of ₩306.5b due within a year, and liabilities of ₩8.54b falling due after that. On the other hand, it had cash of ₩110.1b and ₩211.6b worth of receivables due within a year. So it can boast ₩6.68b more liquid assets than total liabilities.
This surplus suggests that GIIR has a conservative balance sheet, and could probably eliminate its debt without much difficulty. Simply put, the fact that GIIR has more cash than debt is arguably a good indication that it can manage its debt safely.
On top of that, GIIR grew its EBIT by 65% over the last twelve months, and that growth will make it easier to handle its debt. The balance sheet is clearly the area to focus on when you are analysing debt. But it is GIIR's earnings that will influence how the balance sheet holds up in the future. So when considering debt, it's definitely worth looking at the earnings trend. Click here for an interactive snapshot.
Finally, while the tax-man may adore accounting profits, lenders only accept cold hard cash. GIIR may have net cash on the balance sheet, but it is still interesting to look at how well the business converts its earnings before interest and tax (EBIT) to free cash flow, because that will influence both its need for, and its capacity to manage debt. In the last three years, GIIR created free cash flow amounting to 8.2% of its EBIT, an uninspiring performance. That limp level of cash conversion undermines its ability to manage and pay down debt.
Summing up
While it is always sensible to investigate a company's debt, in this case GIIR has ₩108.4b in net cash and a decent-looking balance sheet. And it impressed us with its EBIT growth of 65% over the last year. So we don't think GIIR's use of debt is risky. There's no doubt that we learn most about debt from the balance sheet. But ultimately, every company can contain risks that exist outside of the balance sheet. To that end, you should learn about the 3 warning signs we've spotted with GIIR (including 1 which is shouldn't be ignored) .
At the end of the day, it's often better to focus on companies that are free from net debt. You can access our special list of such companies (all with a track record of profit growth). It's free.
When trading GIIR or any other investment, use the platform considered by many to be the Professional's Gateway to the Worlds Market, Interactive Brokers. You get the lowest-cost* trading on stocks, options, futures, forex, bonds and funds worldwide from a single integrated account. Promoted
Valuation is complex, but we're here to simplify it.
Discover if HS Ad might be undervalued or overvalued with our detailed analysis, featuring fair value estimates, potential risks, dividends, insider trades, and its financial condition.
Access Free AnalysisThis article by Simply Wall St is general in nature. It does not constitute a recommendation to buy or sell any stock, and does not take account of your objectives, or your financial situation. We aim to bring you long-term focused analysis driven by fundamental data. Note that our analysis may not factor in the latest price-sensitive company announcements or qualitative material. Simply Wall St has no position in any stocks mentioned.
*Interactive Brokers Rated Lowest Cost Broker by StockBrokers.com Annual Online Review 2020
Have feedback on this article? Concerned about the content? Get in touch with us directly. Alternatively, email editorial-team@simplywallst.com.
About KOSE:A035000
HS Ad
Operates as an advertising and marketing communications company in Korea and internationally.
Excellent balance sheet average dividend payer.
Market Insights

Advertisement
Community Narratives
MicroVision will explode future revenue by 380.37% with a vision towards success
Fair Value US$60.00|98.4% undervalued
TH
Community Contributor
The Indispensable Artery for a New North American Economy
Fair Value CA$132.87|1.3% undervalued
TI
Community Contributor