
Advertisement
David Iben put it well when he said, 'Volatility is not a risk we care about. What we care about is avoiding the permanent loss of capital.' When we think about how risky a company is, we always like to look at its use of debt, since debt overload can lead to ruin. We can see that NBT inc. (KOSDAQ:236810) does use debt in its business. But the more important question is: how much risk is that debt creating?
What Risk Does Debt Bring?
Debt is a tool to help businesses grow, but if a business is incapable of paying off its lenders, then it exists at their mercy. Part and parcel of capitalism is the process of 'creative destruction' where failed businesses are mercilessly liquidated by their bankers. However, a more usual (but still expensive) situation is where a company must dilute shareholders at a cheap share price simply to get debt under control. Having said that, the most common situation is where a company manages its debt reasonably well - and to its own advantage. The first step when considering a company's debt levels is to consider its cash and debt together.
See our latest analysis for NBT
How Much Debt Does NBT Carry?
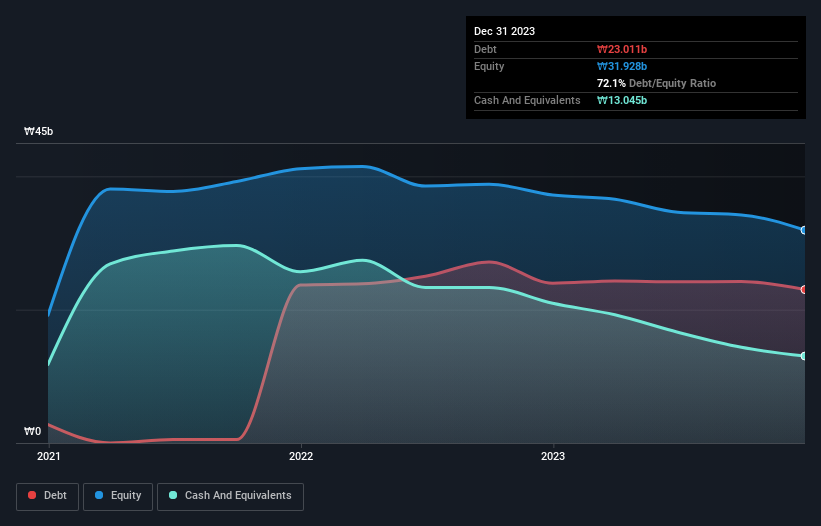
The chart below, which you can click on for greater detail, shows that NBT had ₩23.0b in debt in December 2023; about the same as the year before. However, because it has a cash reserve of ₩13.0b, its net debt is less, at about ₩9.97b.
A Look At NBT's Liabilities
According to the last reported balance sheet, NBT had liabilities of ₩39.6b due within 12 months, and liabilities of ₩3.66b due beyond 12 months. Offsetting these obligations, it had cash of ₩13.0b as well as receivables valued at ₩9.82b due within 12 months. So its liabilities outweigh the sum of its cash and (near-term) receivables by ₩20.4b.
NBT has a market capitalization of ₩98.7b, so it could very likely raise cash to ameliorate its balance sheet, if the need arose. However, it is still worthwhile taking a close look at its ability to pay off debt. The balance sheet is clearly the area to focus on when you are analysing debt. But it is NBT's earnings that will influence how the balance sheet holds up in the future. So when considering debt, it's definitely worth looking at the earnings trend. Click here for an interactive snapshot.
Over 12 months, NBT saw its revenue hold pretty steady, and it did not report positive earnings before interest and tax. While that's not too bad, we'd prefer see growth.
Caveat Emptor
Over the last twelve months NBT produced an earnings before interest and tax (EBIT) loss. To be specific the EBIT loss came in at ₩3.9b. Considering that alongside the liabilities mentioned above does not give us much confidence that company should be using so much debt. Quite frankly we think the balance sheet is far from match-fit, although it could be improved with time. Another cause for caution is that is bled ₩2.9b in negative free cash flow over the last twelve months. So to be blunt we think it is risky. There's no doubt that we learn most about debt from the balance sheet. However, not all investment risk resides within the balance sheet - far from it. For instance, we've identified 2 warning signs for NBT (1 can't be ignored) you should be aware of.
At the end of the day, it's often better to focus on companies that are free from net debt. You can access our special list of such companies (all with a track record of profit growth). It's free.
Valuation is complex, but we're here to simplify it.
Discover if NBT might be undervalued or overvalued with our detailed analysis, featuring fair value estimates, potential risks, dividends, insider trades, and its financial condition.
Access Free AnalysisHave feedback on this article? Concerned about the content? Get in touch with us directly. Alternatively, email editorial-team (at) simplywallst.com.
This article by Simply Wall St is general in nature. We provide commentary based on historical data and analyst forecasts only using an unbiased methodology and our articles are not intended to be financial advice. It does not constitute a recommendation to buy or sell any stock, and does not take account of your objectives, or your financial situation. We aim to bring you long-term focused analysis driven by fundamental data. Note that our analysis may not factor in the latest price-sensitive company announcements or qualitative material. Simply Wall St has no position in any stocks mentioned.
About KOSDAQ:A236810
NBT
Provides mobile advertising services using smartphone applications in South Korea.
Mediocre balance sheet and slightly overvalued.
Market Insights

Advertisement
Community Narratives
The company that turned a verb into a global necessity and basically runs the modern internet, digital ads, smartphones, maps, and AI.
Fair Value US$300.00|6.3% undervalued
OS
Community Contributor
Flowers Foods Pays A Fair Price For Health
Fair Value US$16.12|26.0% undervalued
NV
Community Contributor
TMX Group will thrive with 33.3% profit margin and enduring market moat
Fair Value CA$49.90|3.7% overvalued
LI
Community Contributor