
Advertisement
Some say volatility, rather than debt, is the best way to think about risk as an investor, but Warren Buffett famously said that 'Volatility is far from synonymous with risk.' When we think about how risky a company is, we always like to look at its use of debt, since debt overload can lead to ruin. As with many other companies BENO TNR, Inc. (KOSDAQ:206400) makes use of debt. But is this debt a concern to shareholders?
Why Does Debt Bring Risk?
Debt and other liabilities become risky for a business when it cannot easily fulfill those obligations, either with free cash flow or by raising capital at an attractive price. In the worst case scenario, a company can go bankrupt if it cannot pay its creditors. However, a more frequent (but still costly) occurrence is where a company must issue shares at bargain-basement prices, permanently diluting shareholders, just to shore up its balance sheet. Of course, debt can be an important tool in businesses, particularly capital heavy businesses. The first thing to do when considering how much debt a business uses is to look at its cash and debt together.
View our latest analysis for BENO TNR
What Is BENO TNR's Net Debt?
The image below, which you can click on for greater detail, shows that at March 2024 BENO TNR had debt of ₩28.3b, up from ₩18.7b in one year. But on the other hand it also has ₩42.0b in cash, leading to a ₩13.6b net cash position.
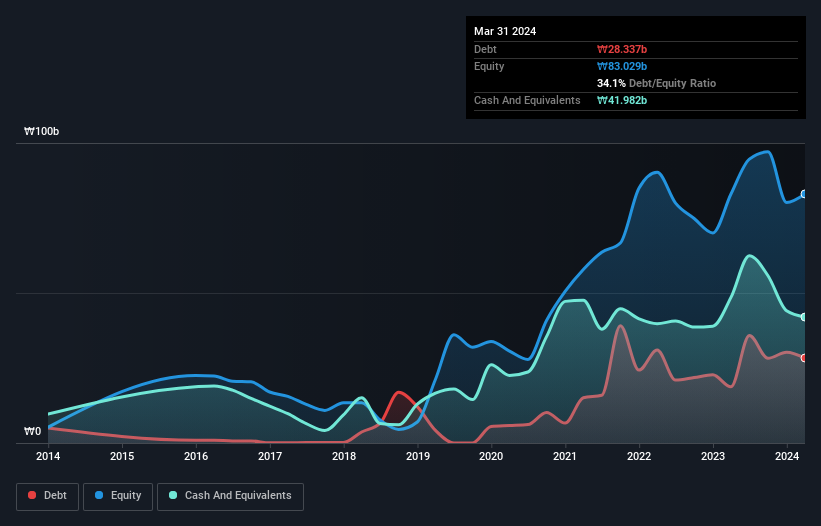
How Healthy Is BENO TNR's Balance Sheet?
Zooming in on the latest balance sheet data, we can see that BENO TNR had liabilities of ₩37.7b due within 12 months and liabilities of ₩2.09b due beyond that. On the other hand, it had cash of ₩42.0b and ₩8.11b worth of receivables due within a year. So it actually has ₩10.3b more liquid assets than total liabilities.
This short term liquidity is a sign that BENO TNR could probably pay off its debt with ease, as its balance sheet is far from stretched. Succinctly put, BENO TNR boasts net cash, so it's fair to say it does not have a heavy debt load! There's no doubt that we learn most about debt from the balance sheet. But you can't view debt in total isolation; since BENO TNR will need earnings to service that debt. So if you're keen to discover more about its earnings, it might be worth checking out this graph of its long term earnings trend.
Over 12 months, BENO TNR made a loss at the EBIT level, and saw its revenue drop to ₩12b, which is a fall of 32%. To be frank that doesn't bode well.
So How Risky Is BENO TNR?
By their very nature companies that are losing money are more risky than those with a long history of profitability. And in the last year BENO TNR had an earnings before interest and tax (EBIT) loss, truth be told. And over the same period it saw negative free cash outflow of ₩4.6b and booked a ₩22b accounting loss. While this does make the company a bit risky, it's important to remember it has net cash of ₩13.6b. That means it could keep spending at its current rate for more than two years. Even though its balance sheet seems sufficiently liquid, debt always makes us a little nervous if a company doesn't produce free cash flow regularly. The balance sheet is clearly the area to focus on when you are analysing debt. But ultimately, every company can contain risks that exist outside of the balance sheet. For example, we've discovered 3 warning signs for BENO TNR (1 makes us a bit uncomfortable!) that you should be aware of before investing here.
At the end of the day, it's often better to focus on companies that are free from net debt. You can access our special list of such companies (all with a track record of profit growth). It's free.
Valuation is complex, but we're here to simplify it.
Discover if BENO TNR might be undervalued or overvalued with our detailed analysis, featuring fair value estimates, potential risks, dividends, insider trades, and its financial condition.
Access Free AnalysisHave feedback on this article? Concerned about the content? Get in touch with us directly. Alternatively, email editorial-team (at) simplywallst.com.
This article by Simply Wall St is general in nature. We provide commentary based on historical data and analyst forecasts only using an unbiased methodology and our articles are not intended to be financial advice. It does not constitute a recommendation to buy or sell any stock, and does not take account of your objectives, or your financial situation. We aim to bring you long-term focused analysis driven by fundamental data. Note that our analysis may not factor in the latest price-sensitive company announcements or qualitative material. Simply Wall St has no position in any stocks mentioned.
About KOSDAQ:A206400
Flawless balance sheet with low risk.
Market Insights

Advertisement
Community Narratives
The company that turned a verb into a global necessity and basically runs the modern internet, digital ads, smartphones, maps, and AI.
Fair Value US$300.00|5.2% undervalued
OS
Community Contributor
Flowers Foods Pays A Fair Price For Health
Fair Value US$16.12|24.9% undervalued
NV
Community Contributor
TMX Group will thrive with 33.3% profit margin and enduring market moat
Fair Value CA$49.90|3.3% overvalued
LI
Community Contributor
The "Molecular Pencil": Why Beam's Technology is Built to Win
Fair Value US$65.01|64.5% undervalued
DA
Community Contributor