
Advertisement
- South Korea
- /
- Chemicals
- /
- KOSDAQ:A120240
Shareholders Of Daejung Chemicals & MetalsLtd (KOSDAQ:120240) Must Be Happy With Their 261% Total Return
When you buy a stock there is always a possibility that it could drop 100%. But on the bright side, you can make far more than 100% on a really good stock. For instance, the price of Daejung Chemicals & Metals Co.,Ltd. (KOSDAQ:120240) stock is up an impressive 224% over the last five years. It's also up 61% in about a month. This could be related to the recent financial results that were recently released - you could check the most recent data by reading our company report.
View our latest analysis for Daejung Chemicals & MetalsLtd
While markets are a powerful pricing mechanism, share prices reflect investor sentiment, not just underlying business performance. One way to examine how market sentiment has changed over time is to look at the interaction between a company's share price and its earnings per share (EPS).
During five years of share price growth, Daejung Chemicals & MetalsLtd actually saw its EPS drop 9.8% per year.
This means it's unlikely the market is judging the company based on earnings growth. Since the change in EPS doesn't seem to correlate with the change in share price, it's worth taking a look at other metrics.
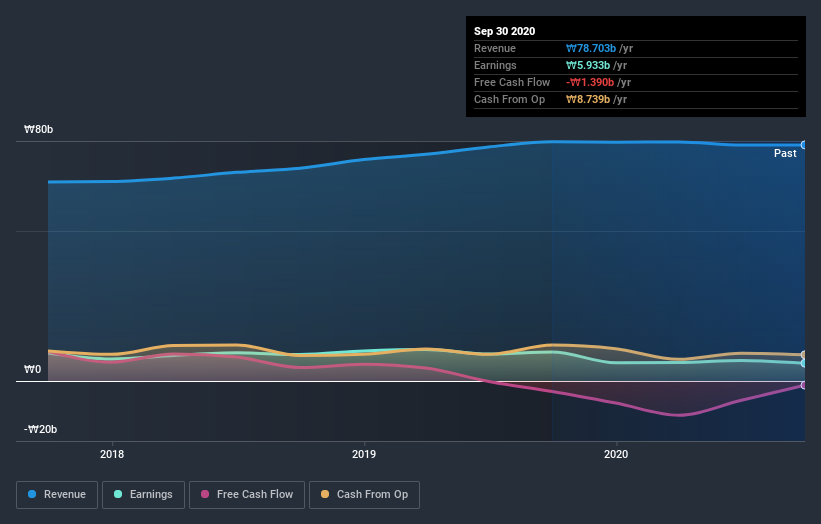
On the other hand, Daejung Chemicals & MetalsLtd's revenue is growing nicely, at a compound rate of 7.5% over the last five years. In that case, the company may be sacrificing current earnings per share to drive growth.
You can see how earnings and revenue have changed over time in the image below (click on the chart to see the exact values).
Balance sheet strength is crucial. It might be well worthwhile taking a look at our free report on how its financial position has changed over time.
What about the Total Shareholder Return (TSR)?
We've already covered Daejung Chemicals & MetalsLtd's share price action, but we should also mention its total shareholder return (TSR). The TSR attempts to capture the value of dividends (as if they were reinvested) as well as any spin-offs or discounted capital raisings offered to shareholders. Daejung Chemicals & MetalsLtd hasn't been paying dividends, but its TSR of 261% exceeds its share price return of 224%, implying it has either spun-off a business, or raised capital at a discount; thereby providing additional value to shareholders.
A Different Perspective
We're pleased to report that Daejung Chemicals & MetalsLtd shareholders have received a total shareholder return of 175% over one year. Since the one-year TSR is better than the five-year TSR (the latter coming in at 29% per year), it would seem that the stock's performance has improved in recent times. In the best case scenario, this may hint at some real business momentum, implying that now could be a great time to delve deeper. I find it very interesting to look at share price over the long term as a proxy for business performance. But to truly gain insight, we need to consider other information, too. Even so, be aware that Daejung Chemicals & MetalsLtd is showing 3 warning signs in our investment analysis , you should know about...
Of course, you might find a fantastic investment by looking elsewhere. So take a peek at this free list of companies we expect will grow earnings.
Please note, the market returns quoted in this article reflect the market weighted average returns of stocks that currently trade on KR exchanges.
If you’re looking to trade Daejung Chemicals & MetalsLtd, open an account with the lowest-cost* platform trusted by professionals, Interactive Brokers. Their clients from over 200 countries and territories trade stocks, options, futures, forex, bonds and funds worldwide from a single integrated account. Promoted
New: Manage All Your Stock Portfolios in One Place
We've created the ultimate portfolio companion for stock investors, and it's free.
• Connect an unlimited number of Portfolios and see your total in one currency
• Be alerted to new Warning Signs or Risks via email or mobile
• Track the Fair Value of your stocks
This article by Simply Wall St is general in nature. It does not constitute a recommendation to buy or sell any stock, and does not take account of your objectives, or your financial situation. We aim to bring you long-term focused analysis driven by fundamental data. Note that our analysis may not factor in the latest price-sensitive company announcements or qualitative material. Simply Wall St has no position in any stocks mentioned.
*Interactive Brokers Rated Lowest Cost Broker by StockBrokers.com Annual Online Review 2020
Have feedback on this article? Concerned about the content? Get in touch with us directly. Alternatively, email editorial-team@simplywallst.com.
About KOSDAQ:A120240
Daejung Chemicals & Metals
Manufactures and sells reagents in South Korea and internationally.
Flawless balance sheet and good value.
Market Insights

Advertisement
Community Narratives
MicroVision will explode future revenue by 380.37% with a vision towards success
Fair Value US$60.00|98.3% undervalued
TH
Community Contributor
The Indispensable Artery for a New North American Economy
Fair Value CA$132.87|1.0% undervalued
TI
Community Contributor