
Advertisement
- South Korea
- /
- Chemicals
- /
- KOSDAQ:A097870
How Well Is HyosungONBCo.Ltd (KOSDAQ:097870) Allocating Its Capital?
When we're researching a company, it's sometimes hard to find the warning signs, but there are some financial metrics that can help spot trouble early. Typically, we'll see the trend of both return on capital employed (ROCE) declining and this usually coincides with a decreasing amount of capital employed. This indicates to us that the business is not only shrinking the size of its net assets, but its returns are falling as well. So after we looked into HyosungONBCo.Ltd (KOSDAQ:097870), the trends above didn't look too great.
Understanding Return On Capital Employed (ROCE)
For those who don't know, ROCE is a measure of a company's yearly pre-tax profit (its return), relative to the capital employed in the business. Analysts use this formula to calculate it for HyosungONBCo.Ltd:
Return on Capital Employed = Earnings Before Interest and Tax (EBIT) ÷ (Total Assets - Current Liabilities)
0.031 = ₩1.9b ÷ (₩71b - ₩8.4b) (Based on the trailing twelve months to September 2020).
Thus, HyosungONBCo.Ltd has an ROCE of 3.1%. In absolute terms, that's a low return and it also under-performs the Chemicals industry average of 8.0%.
View our latest analysis for HyosungONBCo.Ltd
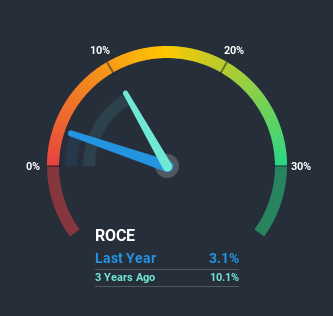
Historical performance is a great place to start when researching a stock so above you can see the gauge for HyosungONBCo.Ltd's ROCE against it's prior returns. If you'd like to look at how HyosungONBCo.Ltd has performed in the past in other metrics, you can view this free graph of past earnings, revenue and cash flow.
The Trend Of ROCE
In terms of HyosungONBCo.Ltd's historical ROCE movements, the trend doesn't inspire confidence. Unfortunately the returns on capital have diminished from the 16% that they were earning five years ago. On top of that, it's worth noting that the amount of capital employed within the business has remained relatively steady. This combination can be indicative of a mature business that still has areas to deploy capital, but the returns received aren't as high due potentially to new competition or smaller margins. So because these trends aren't typically conducive to creating a multi-bagger, we wouldn't hold our breath on HyosungONBCo.Ltd becoming one if things continue as they have.
On a related note, HyosungONBCo.Ltd has decreased its current liabilities to 12% of total assets. That could partly explain why the ROCE has dropped. What's more, this can reduce some aspects of risk to the business because now the company's suppliers or short-term creditors are funding less of its operations. Some would claim this reduces the business' efficiency at generating ROCE since it is now funding more of the operations with its own money.
Our Take On HyosungONBCo.Ltd's ROCE
All in all, the lower returns from the same amount of capital employed aren't exactly signs of a compounding machine. Long term shareholders who've owned the stock over the last five years have experienced a 28% depreciation in their investment, so it appears the market might not like these trends either. That being the case, unless the underlying trends revert to a more positive trajectory, we'd consider looking elsewhere.
If you'd like to know more about HyosungONBCo.Ltd, we've spotted 2 warning signs, and 1 of them is a bit concerning.
For those who like to invest in solid companies, check out this free list of companies with solid balance sheets and high returns on equity.
When trading HyosungONBCo.Ltd or any other investment, use the platform considered by many to be the Professional's Gateway to the Worlds Market, Interactive Brokers. You get the lowest-cost* trading on stocks, options, futures, forex, bonds and funds worldwide from a single integrated account. Promoted
Valuation is complex, but we're here to simplify it.
Discover if HyosungONBCo.Ltd might be undervalued or overvalued with our detailed analysis, featuring fair value estimates, potential risks, dividends, insider trades, and its financial condition.
Access Free AnalysisThis article by Simply Wall St is general in nature. It does not constitute a recommendation to buy or sell any stock, and does not take account of your objectives, or your financial situation. We aim to bring you long-term focused analysis driven by fundamental data. Note that our analysis may not factor in the latest price-sensitive company announcements or qualitative material. Simply Wall St has no position in any stocks mentioned.
*Interactive Brokers Rated Lowest Cost Broker by StockBrokers.com Annual Online Review 2020
Have feedback on this article? Concerned about the content? Get in touch with us directly. Alternatively, email editorial-team (at) simplywallst.com.
About KOSDAQ:A097870
HyosungONBCo.Ltd
Produces and supplies organic fertilizers in South Korea and internationally.
Excellent balance sheet and fair value.
Market Insights

Advertisement
Community Narratives
MicroVision will explode future revenue by 380.37% with a vision towards success
Fair Value US$60.00|98.4% undervalued
TH
Community Contributor
The Indispensable Artery for a New North American Economy
Fair Value CA$132.87|1.3% undervalued
TI
Community Contributor