
Advertisement
- South Korea
- /
- Chemicals
- /
- KOSDAQ:A086710
Sunjin Beauty ScienceLtd's (KOSDAQ:086710) Solid Profits Have Weak Fundamentals
Last week's profit announcement from Sunjin Beauty Science Co.Ltd (KOSDAQ:086710) was underwhelming for investors, despite headline numbers being robust. We did some digging and found some worrying underlying problems.
We've discovered 3 warning signs about Sunjin Beauty ScienceLtd. View them for free.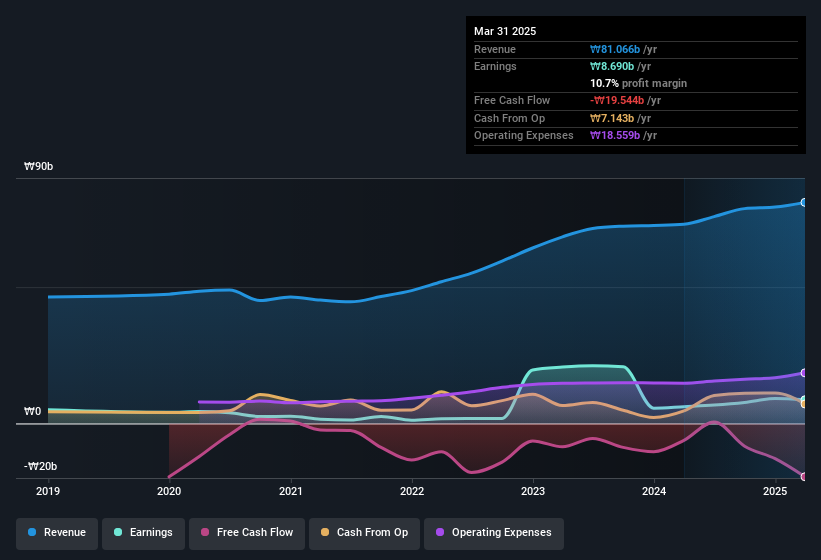
Examining Cashflow Against Sunjin Beauty ScienceLtd's Earnings
As finance nerds would already know, the accrual ratio from cashflow is a key measure for assessing how well a company's free cash flow (FCF) matches its profit. To get the accrual ratio we first subtract FCF from profit for a period, and then divide that number by the average operating assets for the period. You could think of the accrual ratio from cashflow as the 'non-FCF profit ratio'.
As a result, a negative accrual ratio is a positive for the company, and a positive accrual ratio is a negative. While having an accrual ratio above zero is of little concern, we do think it's worth noting when a company has a relatively high accrual ratio. To quote a 2014 paper by Lewellen and Resutek, "firms with higher accruals tend to be less profitable in the future".
Over the twelve months to March 2025, Sunjin Beauty ScienceLtd recorded an accrual ratio of 0.24. We can therefore deduce that its free cash flow fell well short of covering its statutory profit. Even though it reported a profit of ₩8.69b, a look at free cash flow indicates it actually burnt through ₩20b in the last year. Coming off the back of negative free cash flow last year, we imagine some shareholders might wonder if its cash burn of ₩20b, this year, indicates high risk.
That might leave you wondering what analysts are forecasting in terms of future profitability. Luckily, you can click here to see an interactive graph depicting future profitability, based on their estimates.
Our Take On Sunjin Beauty ScienceLtd's Profit Performance
Sunjin Beauty ScienceLtd's accrual ratio for the last twelve months signifies cash conversion is less than ideal, which is a negative when it comes to our view of its earnings. Therefore, it seems possible to us that Sunjin Beauty ScienceLtd's true underlying earnings power is actually less than its statutory profit. But on the bright side, its earnings per share have grown at an extremely impressive rate over the last three years. The goal of this article has been to assess how well we can rely on the statutory earnings to reflect the company's potential, but there is plenty more to consider. With this in mind, we wouldn't consider investing in a stock unless we had a thorough understanding of the risks. To that end, you should learn about the 3 warning signs we've spotted with Sunjin Beauty ScienceLtd (including 2 which are significant).
Today we've zoomed in on a single data point to better understand the nature of Sunjin Beauty ScienceLtd's profit. But there are plenty of other ways to inform your opinion of a company. Some people consider a high return on equity to be a good sign of a quality business. So you may wish to see this free collection of companies boasting high return on equity, or this list of stocks with high insider ownership.
New: Manage All Your Stock Portfolios in One Place
We've created the ultimate portfolio companion for stock investors, and it's free.
• Connect an unlimited number of Portfolios and see your total in one currency
• Be alerted to new Warning Signs or Risks via email or mobile
• Track the Fair Value of your stocks
Have feedback on this article? Concerned about the content? Get in touch with us directly. Alternatively, email editorial-team (at) simplywallst.com.
This article by Simply Wall St is general in nature. We provide commentary based on historical data and analyst forecasts only using an unbiased methodology and our articles are not intended to be financial advice. It does not constitute a recommendation to buy or sell any stock, and does not take account of your objectives, or your financial situation. We aim to bring you long-term focused analysis driven by fundamental data. Note that our analysis may not factor in the latest price-sensitive company announcements or qualitative material. Simply Wall St has no position in any stocks mentioned.
About KOSDAQ:A086710
Sunjin Beauty ScienceLtd
SUNJIN BEAUTY SCIENCE Co. ,Ltd. researches, develops, manufactures, and exports cosmetics, surfactant, and polymer bead products.
Reasonable growth potential with acceptable track record.
Market Insights

Advertisement
Community Narratives
The company that turned a verb into a global necessity and basically runs the modern internet, digital ads, smartphones, maps, and AI.
Fair Value US$300.00|5.2% undervalued
OS
Community Contributor
Flowers Foods Pays A Fair Price For Health
Fair Value US$16.12|24.9% undervalued
NV
Community Contributor
TMX Group will thrive with 33.3% profit margin and enduring market moat
Fair Value CA$49.90|3.3% overvalued
LI
Community Contributor
The "Molecular Pencil": Why Beam's Technology is Built to Win
Fair Value US$65.01|64.5% undervalued
DA
Community Contributor