
Advertisement
- South Korea
- /
- Basic Materials
- /
- KOSDAQ:A060560
What Can The Trends At Home Center HoldingsLtd (KOSDAQ:060560) Tell Us About Their Returns?
If we want to find a stock that could multiply over the long term, what are the underlying trends we should look for? Typically, we'll want to notice a trend of growing return on capital employed (ROCE) and alongside that, an expanding base of capital employed. Put simply, these types of businesses are compounding machines, meaning they are continually reinvesting their earnings at ever-higher rates of return. So on that note, Home Center HoldingsLtd (KOSDAQ:060560) looks quite promising in regards to its trends of return on capital.
Understanding Return On Capital Employed (ROCE)
If you haven't worked with ROCE before, it measures the 'return' (pre-tax profit) a company generates from capital employed in its business. Analysts use this formula to calculate it for Home Center HoldingsLtd:
Return on Capital Employed = Earnings Before Interest and Tax (EBIT) ÷ (Total Assets - Current Liabilities)
0.021 = ₩4.7b ÷ (₩348b - ₩126b) (Based on the trailing twelve months to September 2020).
Thus, Home Center HoldingsLtd has an ROCE of 2.1%. Ultimately, that's a low return and it under-performs the Basic Materials industry average of 3.4%.
Check out our latest analysis for Home Center HoldingsLtd
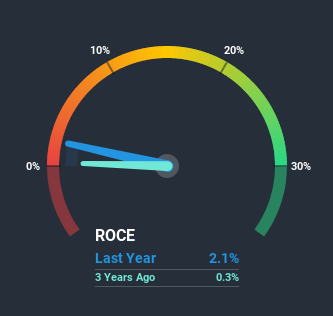
Historical performance is a great place to start when researching a stock so above you can see the gauge for Home Center HoldingsLtd's ROCE against it's prior returns. If you'd like to look at how Home Center HoldingsLtd has performed in the past in other metrics, you can view this free graph of past earnings, revenue and cash flow.
What Can We Tell From Home Center HoldingsLtd's ROCE Trend?
Even though ROCE is still low in absolute terms, it's good to see it's heading in the right direction. The numbers show that in the last five years, the returns generated on capital employed have grown considerably to 2.1%. The amount of capital employed has increased too, by 87%. This can indicate that there's plenty of opportunities to invest capital internally and at ever higher rates, a combination that's common among multi-baggers.
For the record though, there was a noticeable increase in the company's current liabilities over the period, so we would attribute some of the ROCE growth to that. The current liabilities has increased to 36% of total assets, so the business is now more funded by the likes of its suppliers or short-term creditors. Keep an eye out for future increases because when the ratio of current liabilities to total assets gets particularly high, this can introduce some new risks for the business.
The Key Takeaway
A company that is growing its returns on capital and can consistently reinvest in itself is a highly sought after trait, and that's what Home Center HoldingsLtd has. Given the stock has declined 13% in the last five years, this could be a good investment if the valuation and other metrics are also appealing. So researching this company further and determining whether or not these trends will continue seems justified.
If you want to know some of the risks facing Home Center HoldingsLtd we've found 3 warning signs (1 doesn't sit too well with us!) that you should be aware of before investing here.
For those who like to invest in solid companies, check out this free list of companies with solid balance sheets and high returns on equity.
If you decide to trade Home Center HoldingsLtd, use the lowest-cost* platform that is rated #1 Overall by Barron’s, Interactive Brokers. Trade stocks, options, futures, forex, bonds and funds on 135 markets, all from a single integrated account. Promoted
Valuation is complex, but we're here to simplify it.
Discover if Home Center HoldingsLtd might be undervalued or overvalued with our detailed analysis, featuring fair value estimates, potential risks, dividends, insider trades, and its financial condition.
Access Free AnalysisThis article by Simply Wall St is general in nature. It does not constitute a recommendation to buy or sell any stock, and does not take account of your objectives, or your financial situation. We aim to bring you long-term focused analysis driven by fundamental data. Note that our analysis may not factor in the latest price-sensitive company announcements or qualitative material. Simply Wall St has no position in any stocks mentioned.
*Interactive Brokers Rated Lowest Cost Broker by StockBrokers.com Annual Online Review 2020
Have feedback on this article? Concerned about the content? Get in touch with us directly. Alternatively, email editorial-team (at) simplywallst.com.
About KOSDAQ:A060560
Home Center HoldingsLtd
Engages in the manufacture and sale of ready-mix concrete in South Korea.
Moderate risk with imperfect balance sheet.
Market Insights

Advertisement
Community Narratives
The company that turned a verb into a global necessity and basically runs the modern internet, digital ads, smartphones, maps, and AI.
Fair Value US$300.00|6.3% undervalued
OS
Community Contributor
Flowers Foods Pays A Fair Price For Health
Fair Value US$16.12|26.0% undervalued
NV
Community Contributor
TMX Group will thrive with 33.3% profit margin and enduring market moat
Fair Value CA$49.90|3.7% overvalued
LI
Community Contributor