- South Korea
- /
- Metals and Mining
- /
- KOSDAQ:A053260
Keum Kang Steel (KOSDAQ:053260) Share Prices Have Dropped 21% In The Last Five Years
The main aim of stock picking is to find the market-beating stocks. But in any portfolio, there will be mixed results between individual stocks. So we wouldn't blame long term Keum Kang Steel Co., Ltd. (KOSDAQ:053260) shareholders for doubting their decision to hold, with the stock down 21% over a half decade.
Check out our latest analysis for Keum Kang Steel
There is no denying that markets are sometimes efficient, but prices do not always reflect underlying business performance. One flawed but reasonable way to assess how sentiment around a company has changed is to compare the earnings per share (EPS) with the share price.
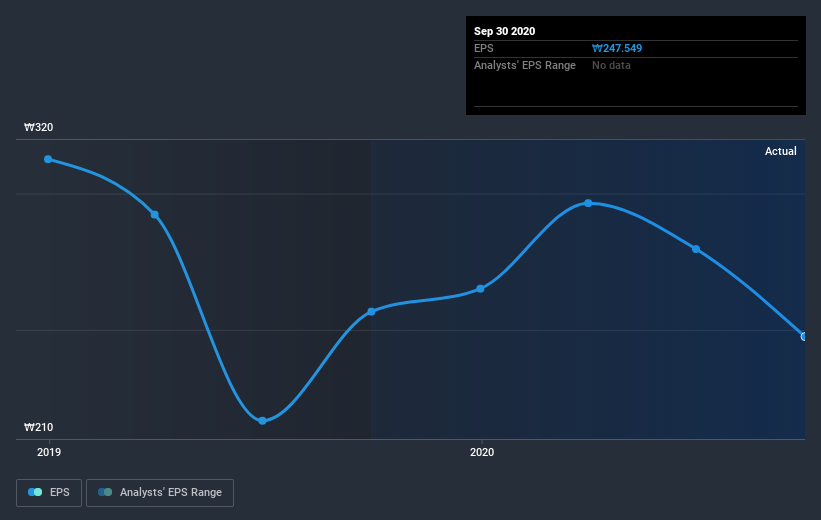
Looking back five years, both Keum Kang Steel's share price and EPS declined; the latter at a rate of 4.3% per year. This change in EPS is remarkably close to the 5% average annual decrease in the share price. This implies that the market has had a fairly steady view of the stock. So it's fair to say the share price has been responding to changes in EPS.
The graphic below depicts how EPS has changed over time (unveil the exact values by clicking on the image).

Dive deeper into Keum Kang Steel's key metrics by checking this interactive graph of Keum Kang Steel's earnings, revenue and cash flow.
What About Dividends?
As well as measuring the share price return, investors should also consider the total shareholder return (TSR). The TSR incorporates the value of any spin-offs or discounted capital raisings, along with any dividends, based on the assumption that the dividends are reinvested. It's fair to say that the TSR gives a more complete picture for stocks that pay a dividend. In the case of Keum Kang Steel, it has a TSR of -9.7% for the last 5 years. That exceeds its share price return that we previously mentioned. And there's no prize for guessing that the dividend payments largely explain the divergence!
A Different Perspective
Investors in Keum Kang Steel had a tough year, with a total loss of 0.6% (including dividends), against a market gain of about 48%. Even the share prices of good stocks drop sometimes, but we want to see improvements in the fundamental metrics of a business, before getting too interested. Unfortunately, longer term shareholders are suffering worse, given the loss of 1.9% doled out over the last five years. We'd need to see some sustained improvements in the key metrics before we could muster much enthusiasm. It's always interesting to track share price performance over the longer term. But to understand Keum Kang Steel better, we need to consider many other factors. Like risks, for instance. Every company has them, and we've spotted 2 warning signs for Keum Kang Steel (of which 1 makes us a bit uncomfortable!) you should know about.
If you would prefer to check out another company -- one with potentially superior financials -- then do not miss this free list of companies that have proven they can grow earnings.
Please note, the market returns quoted in this article reflect the market weighted average returns of stocks that currently trade on KR exchanges.
If you’re looking to trade Keum Kang Steel, open an account with the lowest-cost* platform trusted by professionals, Interactive Brokers. Their clients from over 200 countries and territories trade stocks, options, futures, forex, bonds and funds worldwide from a single integrated account. Promoted
Valuation is complex, but we're here to simplify it.
Discover if Keum Kang Steel might be undervalued or overvalued with our detailed analysis, featuring fair value estimates, potential risks, dividends, insider trades, and its financial condition.
Access Free AnalysisThis article by Simply Wall St is general in nature. It does not constitute a recommendation to buy or sell any stock, and does not take account of your objectives, or your financial situation. We aim to bring you long-term focused analysis driven by fundamental data. Note that our analysis may not factor in the latest price-sensitive company announcements or qualitative material. Simply Wall St has no position in any stocks mentioned.
*Interactive Brokers Rated Lowest Cost Broker by StockBrokers.com Annual Online Review 2020
Have feedback on this article? Concerned about the content? Get in touch with us directly. Alternatively, email editorial-team (at) simplywallst.com.
About KOSDAQ:A053260
Keum Kang Steel
Processes, produces, and sells cold-rolled coils in South Korea.
Flawless balance sheet and fair value.
Market Insights
Community Narratives


